We'll be brief today, as it's going to be tough to distinguish how much effect last week's triple-witching exerted (which we don't want to read too much into), versus how much of last week's gains were actually reflective of investor's opinions (which we think is more meaningful). That being said, even if the gains were artificial, they can still creat a ripple effect for this week and beyond.
NASDAQ Commentary
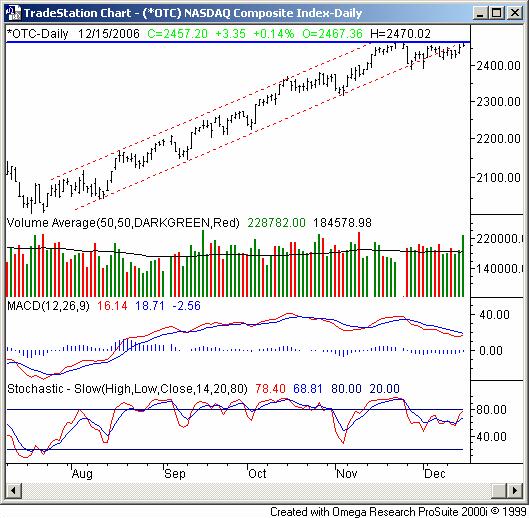
The NASDAQ Composite closed at 2457.20 - higher than Thursday's close by 3.35 points (+0.14%) - to end the triple-witching week up by 0.81% (+19.84 points). While any gain is nice for the bulls, there are two things worth noting about the NASDAQ this week: (1) it was a very modest gain that pales in comparison to the types of numbers being put up just a few weeks ago, and (2) the NASDAQ struggled to challenge its prior high of 2468.42 from November 27, and never actually made a close above that mark.
Aside from the failure to break above the resistance (blue), the composite didn't even manage to get back above the lower support line of the bullish channel (dashed) framed over the last few weeks. So, regardless of whether or not a correction has begun or not, it's clear the rate or pace of gains is slipping. However, none of that changes the fact that the bulls need to clear the 2470 hurdle (Friday's high) with a little conviction before we can get excited about new long positions.
Notice that we're on the verge of a bullish MACD crossover. To complete it, we'll have to move just a little higher, perhaps above 2470. So, the two events may end up being co-confirmation of any new bullishness.
NASDAQ Chart - Daily

S&P 500 Commentary
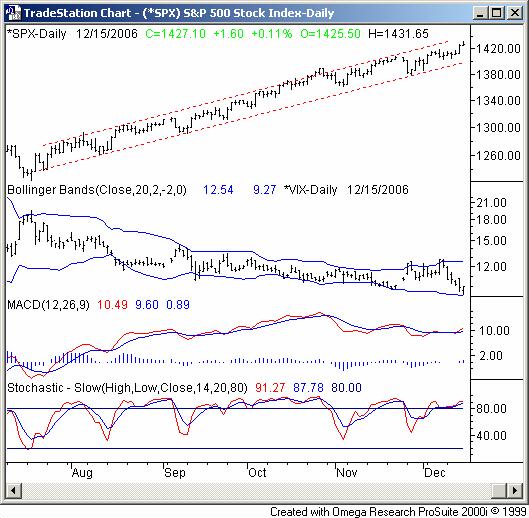
The S&P 500 gained 1.60 points, or 0.11%, on Friday to end the session at 1427.10. On a weekly basis, that meant a 1.22%, 17.25 point gain, which suspiciously topped the NASDAQ's weekly gain. However, the SPX's relative outperformance isn't exactly something new....we've seen the S&P 500 lead the way for the better part of the last month or so. From a momentum perspective it makes you want to jump on board with the large caps. From a reversal perspective, we have to wonder if this index will fall the farthest once any correction sets in.
As it stands right now, we see the S&P 500 being vulnerable - in the short run - for a handful of reasons.
The first one is simply how the chart is stochastically overbought (again) at the same time that it's pushing into the upper edge of a longer-term bullish channel. It's not quite at the absolute upper limit, assuming there even is one. But, it's getting close, and we think that could weigh heavily in the near term. In the interest of fairness though, it didn't seem to be a factor when the S&P 500 rallied sharply in October, the index was well overbought the entire time.
The other key reason we wouldn't be surprised to see at least a brief dip is the CBOE Volatility Index (VIX). It hit new multi-year lows on Friday after five straight sessions of lower closes. The sixth day (Friday), however, we saw a pretty big mid-day reversal near the lower Bollinger band which suggests the VIX may be ready to bounce higher again.
Yes, we have little doubt that the very rare triple-witching option expiration was the ultimate cause of the big downtrend for the VIX. But as we said above, there's still going to be some sort of after-effect. In this case, regardless of the reason, we expect to see the VIX pressured higher again, at least back to less extreme levels. In general, we can expect a rising VIX to coincide with selling pressure on stocks.
Yet, it's all conjecture at this point. The fact is, we have a new bullish MACD crossover, and a simple eyeball-look at the chart shows you the current trend is to the upside.
A mixed message? That's an understatement. Be patient here; we think we'll see some more dependable patterns put in place this week.
S&P 500 Chart - Daily

Dow Jones Industrial Average Commentary
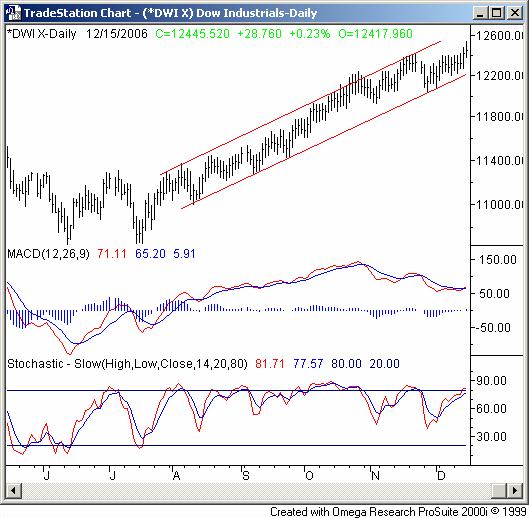
The Dow's 0.23% gain on Friday left it 28.76 points higher, at 12,445.52. For the week, the blue-chip index closed 138.03 points higher, gaining 1.12%. The interesting part about the Dow's chart is, it's not nearly as over-extended as the S&P 500's is, but still managed to hit new all-time highs. Given that we have a new MACD crossover AND that the upper resistance line of the Dow's long-term bullish channel is still not being pressured, we could make a strong case for more upside here.
Could the key differences in the indices be highly evident right now? We know the large caps are leading - the S&P 500 has put up superior numbers recently. Small cap, which make up a big chunk of the NASDAQ, apparently are acting as a drag. The Dow's blue chips (mostly large caps, but selected more on quality than size) are nestled somewhere in between...and seem to offer the safest haven for long-only traders right now. What we find curious is how the January effect, where small caps tend to outperform everything else, actually starts in mid-January.
The point is, there are more than a couple of dynamics worth monitoring right now. We'll revisit these ideas next week when - hopefully - the picture is a little more clear.
Dow Jones Industrial Average Chart

Price Headley is the founder and chief analyst of BigTrends.com.