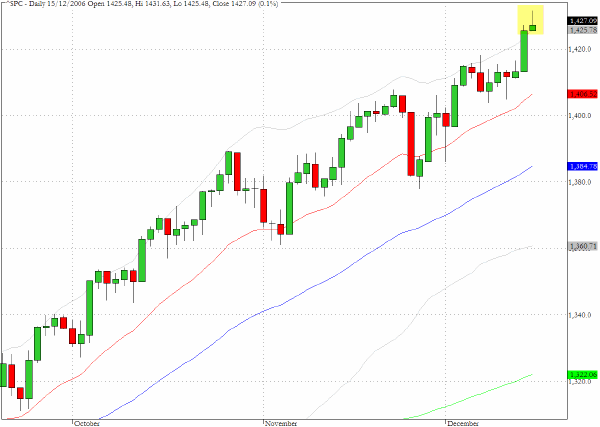
The S&P 500 (^SPC) closed at 1427 on Friday, which places it just 100 points below its all-time high achieved in March 2000.
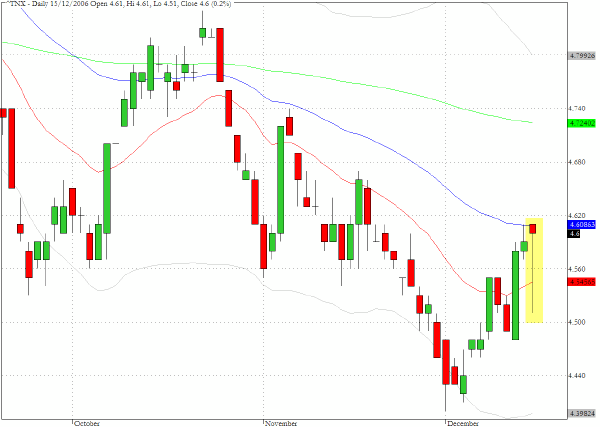
Treasury prices have been showing a high degree of intraday volatility recently and Friday was no exception. The yield on the ten year note, having tested the 4.4% level has moved back to the 4.6% level which is exactly as we discussed in last weekend's commentary. However Friday's intraday range for the yield covered nine basis points which highlights the cross currents that are influencing sentiment and making the market quite jittery.

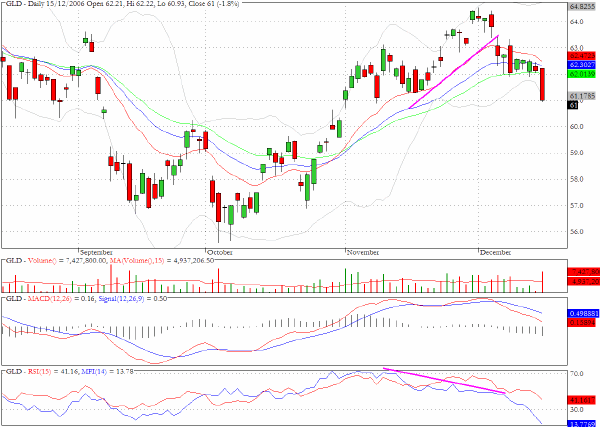
The Streetracks Gold trust fund GLD reveals the weakness that hit the gold and silver sector during the course of Friday√Ę‚,¨‚"Ęs trading. The most interesting feature of the chart is revealed by the two lines that we have drawn - one on the price chart and the other on the MFI chart segment. The steep upward slant to the line on the price chart during the last two weeks of November coincides with the push above $64 (equating to $640 for the precious metal) but switching attention to the slant to the money flow during the same time frame it can be seen that this is diverging negatively.
The pattern is a good example of the kind of market dissonance which is discussed in Long/Short Market Dynamics
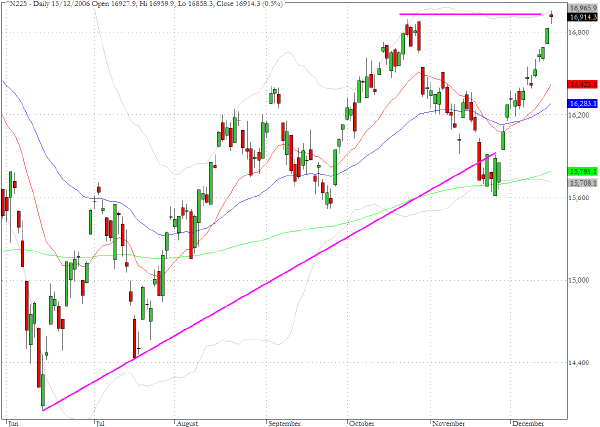
The Nikkei 225 (^N225) has made a remarkable recovery from the weakness in November which saw the index violating the upward trendline through key lows. The action Friday brought the index back to potential resistance at the October high but the most recent multi-year high lies further ahead at 17563 which was registered earlier this year on April 7.
TRADE OPPORTUNITIES/SETUPS FOR MONDAY DECEMBER 18, 2006
The patterns identified below should be considered as indicative of eventual price direction in forthcoming trading sessions. None of these setups should be seen as specifically opportune for the current trading session.
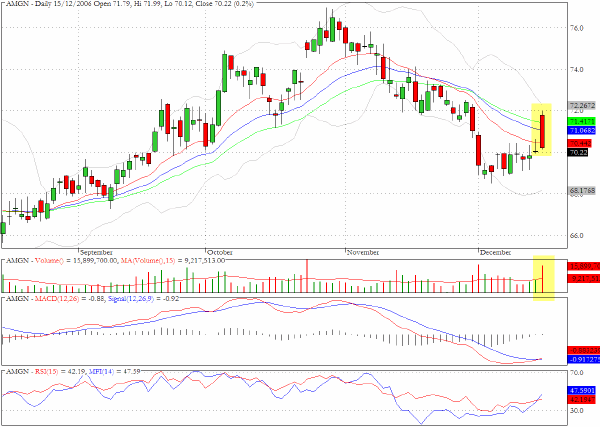
Amgen (AMGN) actually moved up 0.2% on Friday but ran into a sustained bout of selling at $72.
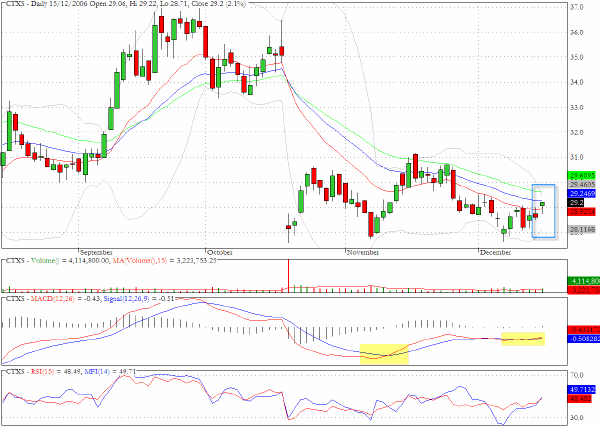
Citrix Systems (CTXS) is displaying some positive MACD divergences and the constricted range suggests that range expansion is imminent.
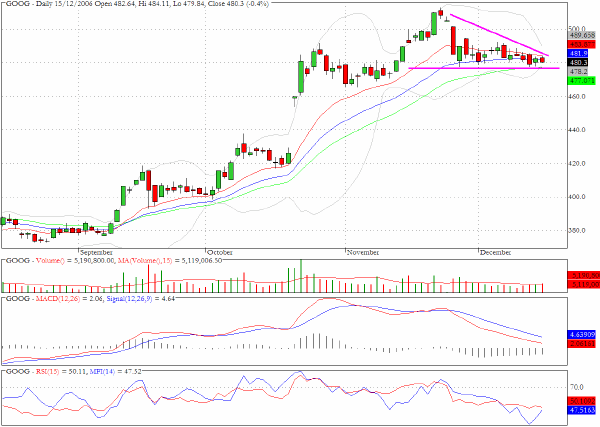
Google (GOOG) appears to be confined within a descending triangle or wedge formation.
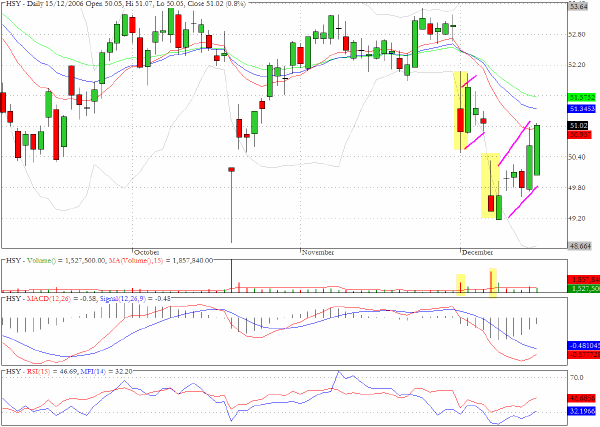
Hershey Foods (HSY) plummeted in mid-October on huge volume and the recent efforts to recover could meet further resistance just above Friday's close.
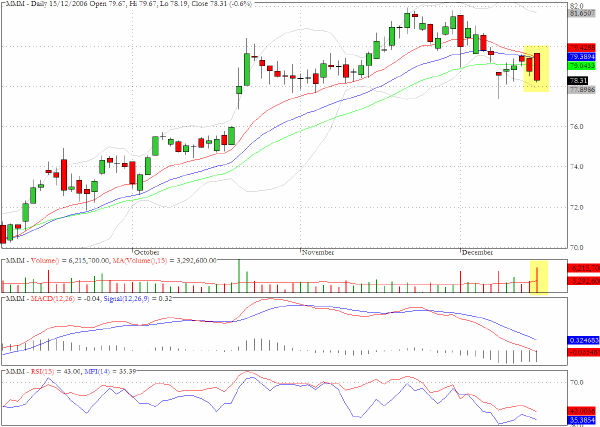
3M (MMM) closed below all three moving averages on twice the average volume.
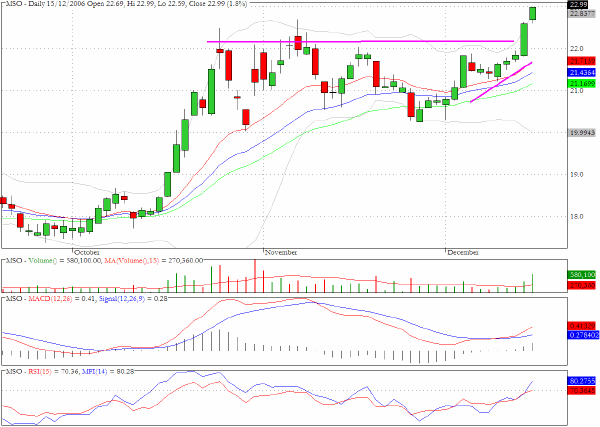
Martha Stewart (MSO) has a very well defined ascending triangle breakout pattern and the money flow suggests that this should have further to go.
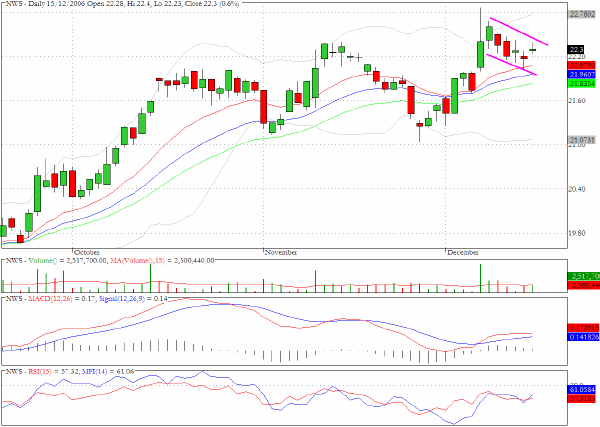
News Corporation (NWS) has had some difficulty in sustaining the November breakout above $22, but the recent pullback pattern could be close to completion.
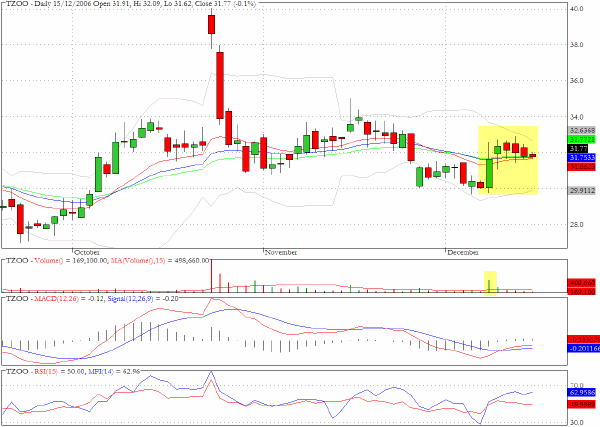
All three moving averages that we track have converged for Travelzoo (TZOO) and the range has constricted. A breakout seems imminent and the money flow is suggesting that it will be to the upside.
Clive Corcoran is the publisher of TradeWithForm.com, which provides daily analysis and commentary on the US stock market. He specializes in market neutral investing and and is currently working on a book about the benefits of trading with long/short strategies, which is scheduled for publication later this year.
Disclaimer
The purpose of this article is to offer you the chance to review the trading methodology, risk reduction strategies and portfolio construction techniques described at tradewithform.com. There is no guarantee that the trading strategies advocated will be profitable. Moreover, there is a risk that following these strategies will lead to loss of capital. Past results are no guarante of future results. Trading stocks and CFD's can yield large rewards, but also has large potential risks. Trading with leverage can be especially risky. You should be fully aware of the risks of trading in the capital markets. You are strongly advised not to trade with capital.