NASDAQ Commentary
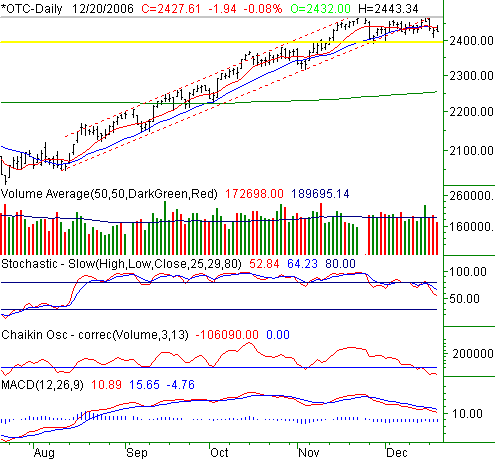
On Wednesday, the NASDAQ Composite fell by 1.94 points, losing only 0.08% to end the session at 2427.61. For the week so far, that means a dip of 29.59 points, thanks to Monday's good-sized loss. With the NASDAQ down 1.2% already for the week (the worst of all the indices), we have to wonder if this leading index is waving a red flag the bulls should take note of. Although the other index charts may look positive, the NASDAQ's is turning 'a little downside volatility' into something more bearishly potent.
There's one over-arching theme here. The NASDAQ's technicals are decidedly bearish, while the other charts technical reads are still actually bullish. It's a disparity worth discussing by itself, which we will another time.
In the meantime, there are a handful of things we see as good for the bears.

The first is obvious - the NASDAQ is under a key long-term support line (red, dashed). In fact, it's been under this support line for more than a week. Simultaneously, the composite us under its 10 day (red) and 20 day (blue) moving averages, and has been spending a heck of a lot of time under those lines as well. The tell-tale sign is how both the 10 and 20 day lines are now under that key support line.
As for the seasonal bullishness, we can't say the NASDAQ has been a beneficiary of the idea. Why? The NASDAQ's close of 2427.61 yesterday is about where it closed on November 14. So, what bullishness? The composite hasn't made any real progress.
However, the index has managed to make a meaningful resistance level at 2470 (gray). We saw the NASDAQ top out there late last week and again this Monday, as well as seeing a top there right around Thanksgiving. In the short run, that's going to be the line in the sand. For us to get bullish again, the buyers are going to have to muster enough strength to break that barrier.
On the downside, we've plotted horizontal support around 2390 to 2395 (yellow). That's been the bounce point a couple of times lately, saving the NASDAQ from what might have otherwise been the beginning of a bigger bearish turn. Despite the fact that the 10- and 20-day lines at 2437 seem to be resistance now, only a close under 2390 would really clinch a bearish opinion.
NASDAQ Chart

S&P 500 Commentary
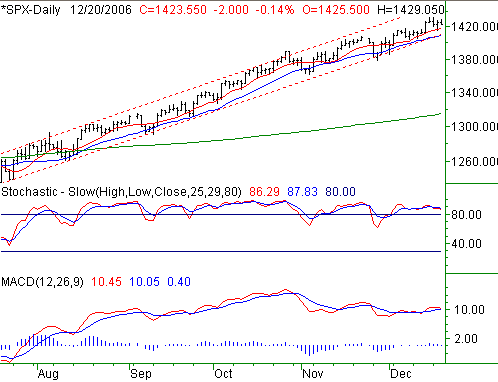
Yesterday's loss of 2.0 points (-0.14%) left the S&P 500 at 1423.55. That's 3.55 points under last Friday's close though, meaning the index is in the hole by 0.25% for the week. And once again, we find ourselves caught between a rock and a hard place. The market doesn't seem like it could possibly go any higher, yet, we see no real evidence that the sellers are interested in getting started either, as they yield to the tentative bulls.
Did someone say the NASDAQ was in a bearish funk? Well, it is, but that doesn't have to mean the SPX is too. The large-caps remain on top of their 10 and 20 day average lines, and also remains within what has become a very long-term bullish channel. See the dashed lines for that framework.
Stochastically overbought? Bah - we've been overbought for most of the time since August! A MACD crossunder? Bah - we've seen three of them since late October. The market hasn't cared yet, so why would now be any different. The point is, the trend remains bullish, even though we'd be the first to say the likelihood of such strength was extremely low. The lesson to be learned is to act on what the market is doing - not on what you think it should be doing.
In any case, although choppy and mostly convictionless (and that's an understatement), the S&P 500 has found a way to continue to scrape out gains for five straight months now. Granted, each new rally looks like it's got a little less zest than the last one, but the bears have yet to actually take a big bite out of the uptrend.
As far as what would constitute more certainty of any impending correction, we're looking for a couple of closes under the long-term support line, currently at 1403. We would see be wary of a close under the 10- or 20-day averages, but truthfully, that hasn't meant much lately.
On a side note, the SPX is now 8.5% above the 200-day moving average line (green) now. That in itself is a statistical oddity, and more importantly, seems to be weighing in a little more each passing day. The headache as that we're also now entering the bullish 'Santa Claus' rally time of year. It's rarely a big rally by any standards; it's more the effect of a lack of sellers. Yet, we can't deny the typical rise we're likely to see the next few days. Of course, this may end up negating the 'too high above the 200 day line' effect - at least for the time being.
S&P 500 Chart

Dow Jones Industrials Commentary
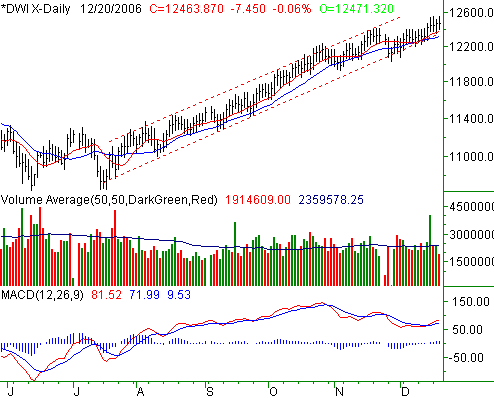
The Dow's close at 12,463.87 on Wednesday was essentially flat, in that it was only 0.06% (-7.45 points) lower than Tuesday's close. On a weekly basis so far, the change is equally uneventful, as the blue chip index is up by a mere 0.15%, or +18.35 points. Technically, the Dow's uptrend is still alive, but we sense a little sluggishness.
Like the other indices, the Dow has framed a pretty narrow bullish channel in the latter half of this year. Unlike the NASDAQ though, the Dow is still actually inside its channel...and finding support at its 10 day line as of the time of this writing. Bullish volume and upside momentum are still in place, even if a little tepid. So, there's not much point in dwelling on the same concepts we already discussed above.
Instead, we'll just define the key support line at 12,260. It's rising a little each day though, so adjust accordingly.
Dow Jones Industrials Chart

Price Headley is the founder and chief analyst of BigTrends.com.