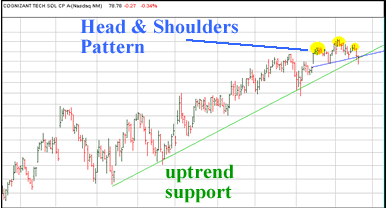
Cognizant Technology (CTSH) has traded along uptrend support the past few months. The stock has recently created a Head & Shoulders reversal pattern, suggesting a reversal in the stocks upside trend. On the chart below, the left shoulder, head, and right shoulder are highlighted in yellow. The neckline of the H&S pattern is represented by the blue line on the chart. The break of the neckline strengthens the potential for downside action. Yesterday's price action took CTSH below uptrend support. A close below the support level furthers signifies the potential reversal in trend. I would not want to be on the long side of CTSH.


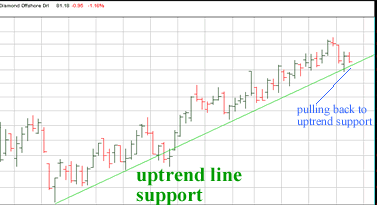
Below is a 3-month daily bars chart for Diamond Offshore Drilling, Inc. (DO). The stock has been trending higher for the past three months. I like what I see here. The trendline is at a solid 45 degree angle suggesting it is stable and should hold. There was a small break about a month and a half ago, but nothing that deters me from gaining interest. Yesterday's pullback to uptrend support provides an optimal point of entry in DO.

Andy Swan is co-founder and head trader for DaytradeTeam.com. To get all of Andy's day trading, swing trading, and options trading alerts in real time, subscribe to a one-week, all-inclusive trial membership to DaytradeTeam by clicking here.