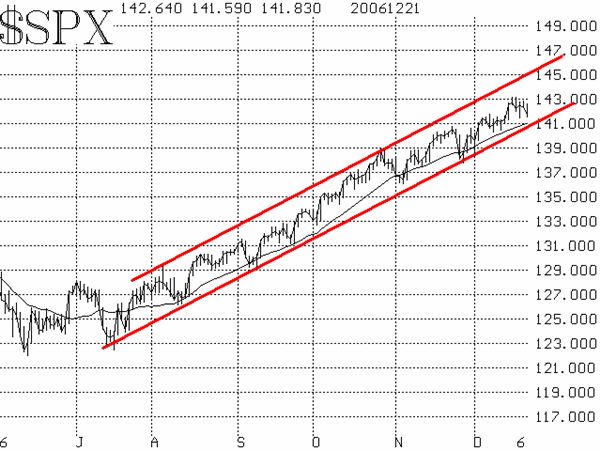
Some serious cracks are beginning to appear in the veneer of this market, but outright broad market sell signals are not yet in effect. The main bullish fact is that $SPX remains in its uptrending channel. As long as that continues, one cannot be bearish on the market, no matter what other technical indicators might be saying "sell." The bottom of the $SPX channel has now risen to nearly 1410. So, any close below 1405, say, would be a breakdown and thus a sell signal from the $SPX chart. Lacking that, the chart pattern would remain bullish.

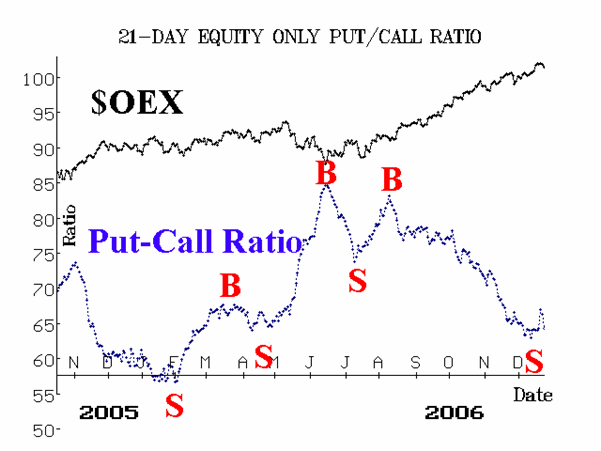
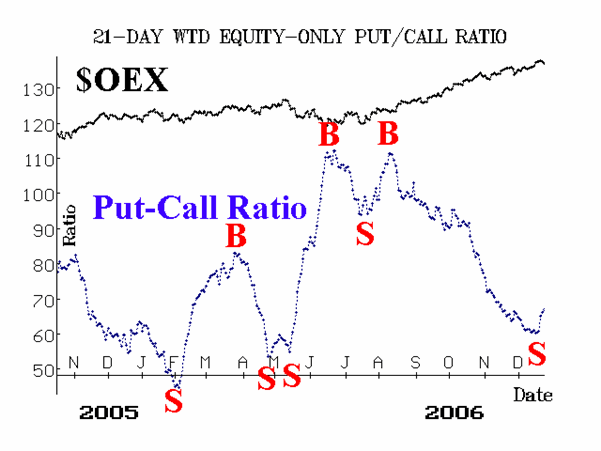
The equity-only put-call ratios have both given confirmed sell signals. This is an important and very negative intermediate-term development. The first negative clue came when our computer analyses "predicted" that the ratios were about to roll over. Right on cue, within a few days, both had indeed begun to rise -- the definition of a sell signal.

Market breadth has been poor and sell signals have been generated. These are confirming indicators, and so the combination of put-call ratio sell signals and breadth sell signals is definitely a cause for concern.

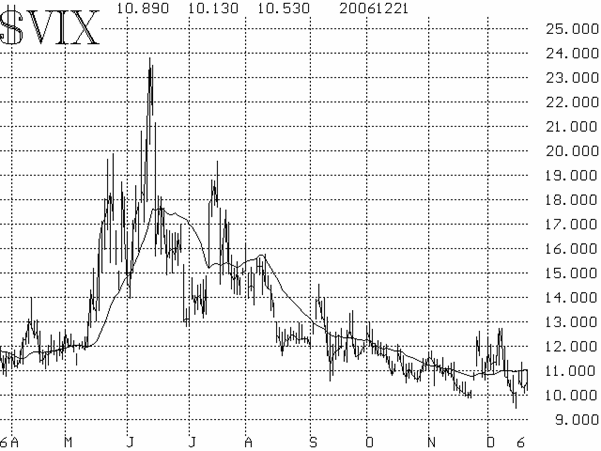
Finally, the volatility indices ($VIX and $VXO) remain at or near historically low levels -- trading at 10 or below. As such, they remain in a passive mode: as long as they are low, the market can continue to rise. However, if $VIX were to begin to trend higher, then it would generate a sell signal as well.

In summary, the $SPX chart is bullish, while volatility indices are still supportive, but put-call ratios are breadth have turned negative. There is also a seasonal factor at work: the market is typically bullish and non-volatile as the year winds down. There is a name for this: the Santa Claus rally, which identifies a normally bullish pattern spanning the last 4 trading days of one year and the first 2 trading days of the next year. However, if this period is bearish, then it often implies a more bearish period lies ahead. "If Santa Claus should fail to call, Bears may come to Broad and Wall."
Lawrence G. McMillan is the author of two best selling books on options, including Options as a Strategic Investment, recognized as essential resources for any serious option trader's library.