NASDAQ Commentary
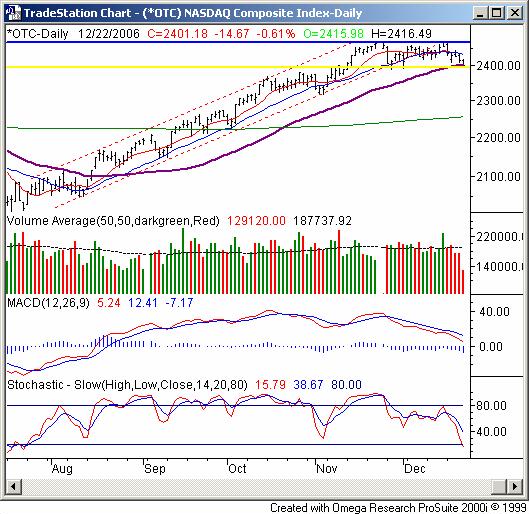
The NASDAQ Composite was already in a bearish most the last few days, and the end to last week didn't do anything to negate that theme. The index lost 0.61% on Friday, closing lower by 14.67 points to end the session at 2401.18. For the week, the NASDAQ lost 56.02 points, or 2.28% - the worst showing for any of the indices.
It was five straight losses in a row for the NASDAQ last week. which pulled the index well below any real hop of bouncing back up above its long-term support level (dashed). In fact, it appeared as if the 10- and 20-day lines (red and blue) acted as resistance last week. As a result, the composite was shoved all the way back under its 50-day average (purple). This is no small matter. It's the first time the NASDAQ has even touched the 50-day line since August 15. And, to see it happen after support from that same point in time has been broken is the reason we think the overall tone has changed.

In the meantime, you'll recall we mentioned that final support line at 2394 (yellow). It too is being tested, If it and the 50-day average break - as we think they will - then there's no likely floor to stop any tumble until the 200-day line (green) at 2256.
By the way, the MACD lines called this one a long time ago when we saw a bearish crossunder in late November.
NASDAQ Chart - Daily

S&P 500 Commentary
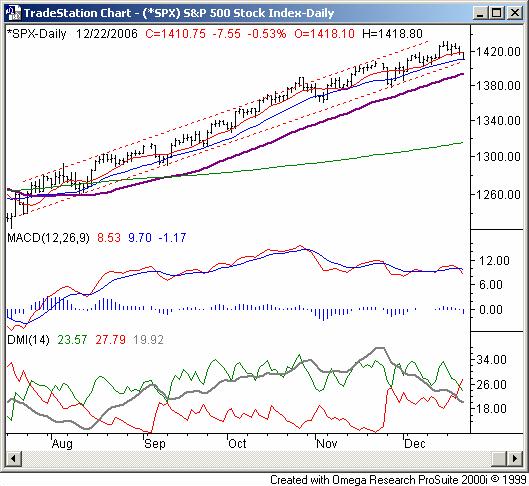
The S&P 500 lost 0.53% on Friday (-7.55 points) to end the session at 1410.75. On a weekly basis, the large-cap index saw a 16.35 point decline, closing 1.15% under the prior Friday's closing level. While the technical uptrend is still intact on most fronts, we're now finally starting to see some hints that the complexion is actually changing towards a bearish bias -- maybe.
Despite losing some ground last week, the fact is that the SPX is still within the framework of the bullish channel that goes back to August. Look at the lower of the two dashed lines. The index is still above it. For that matter, the index is still even above its 20-day line, which has been a key support area throughout this four month bullish period. So while our take on the NASDAQ's chart may have been a pessimistic one, the bulls are still very much alive according to this chart.
That being said, there is one victory for the bears we have to mention. We discussed the Directional Movement Index (DMI) indicator a couple of weeks ago - not because it had done anything meaningful, but rather because it hadn't yet. We were waiting for a cross of the DMI- line (red) above the DMI+ line (green) to tell us the daily highs were getting lower, while the lows were as well - clearly a bearish pressure. Well, we finally got it on Friday. See the bottom of the chart to view the indicator - we have a bearish DMI cross for the first time in months. We'll be curious to see if this rare signal actually makes good on its bearish potential
In the meantime, keep on eye on the support line at 1406, and the potential support from the 50-day average at 1393.
With that in mind, if there was ever a week for the market to do something odd, this coming week may be the week. More often that not there's a Santa Claus rally, mild bullishness characterized by a lack of sellers more than a lot of buyers. It's a last-minute effort to own positions by the end of the calendar year -- a practice that doesn't exactly serve any real tax-help purposes, but might help a few fund managers 'dress their windows' before reporting their year-end holdings. This time around though, we have to wonder if last week's slide joined with hefty profits from the last five months will encourage some significant profit-taking before this year's end, which could actually help in terms of taxes.
The point is, we're not necessarily counting on a Santa Clause rally this year. We may see it, but we won't be shocked if we don't. If anything, if the SPX breaks down under its support level, we'd be surprised if we didn't see a rather heavy (relatively) dose of selling. We'll see how it goes.
S&P 500 Chart - Daily

Dow Jones Industrial Average Commentary
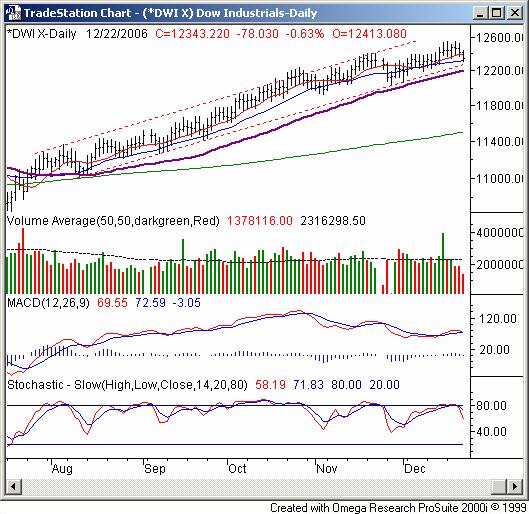
The Dow Jones Industrials lost a little ground on Friday, giving up 78.03 points (-0.63%) to close at 12,343.22. That was 102.3 points below the previous Friday's close, setting up a 0.83% loss for the week. Those are rather tepid numbers for either direction, so the results themselves don't necessarily have to have the bulls running for the hills. And for that matter, the Dow's long-term support line is still intact for now.
Since this chart pretty much mirrors the S&P 500's, we're not going to repeat the opinion.
However, do keep in mind that U.S. markets are closed on Monday, and trading is probably going to be light - and somewhat uneventful - all week.
Dow Jones Industrial Average Chart

Price Headley is the founder and chief analyst of BigTrends.com.