NASDAQ COMMENTARY
After crossing back under the 10 and 20 day averages late last week, the NASDAQ has been able to work back above them over the last two and a half sessions. For the week, the composite is up about 19 points. For the last two full weeks (and four weeks, for that matter), the composite is basically even, verifying that a lot of volatility doesn't have to mean that the charts are moving.
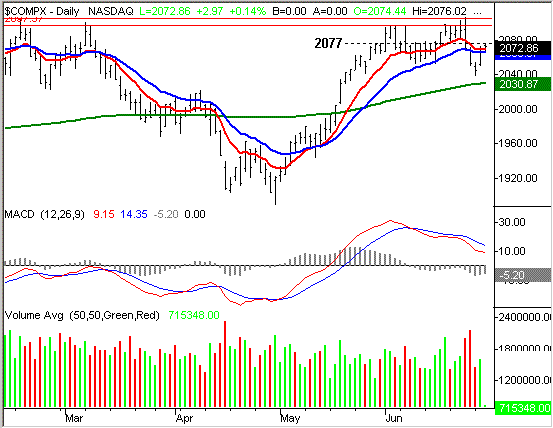
In fact, there's nothing about today's chart that suggests we're any closer to some decent movement. Yesterday's cross back above the 10 day moving average (red) was feeble, and there's no follow-through at all today. That could have been expected though - volume was weak behind yesterday's move. Also weighing in on the NASDAQ is the resistance at 2077. This problem area was first defined two weeks ago. Although it was breached briefly last week, hitting it with today's high (2076.02) sparked a turnaround, bringing the index back down to its current 2073 mark. So as of right now, the composite is trapped between support at the 20 day moving average (blue, 2067) and the resistance at 2077.
The thing is, even if that resistance is broken, we've got more at 2100 (a lot more), and then even more at 2105 (see the horizontal red lines). That, however, is something that we don't think we'll be contending with just yet. Instead, the momentum after last week seems like it's going to pull the composite lower despite the bullishness we saw yesterday. The MACD lines gave us a negative divergence in early June, and that signal has actually strengthened, even though the market hasn't yet complied. There are leading aspects to this tool though, so we still have to assume the bearish MACD cross will lead a downside move for stocks.
As for where it might end, the 200 day line at 2030 will probably act as support. That's only a 40 point move though (about 2%). That might be big enough to trade, but considering just how choppy the water has been lately, it may not be worth the trouble, or the risk. If we break under the 200 day average after seeing all these bearish signs, then the bears would have something to get excited about. After the 200 day line, the next likely support level is this year's low of 1890. As for any bullishness, we'd need to see a break above 2105 before saying we've pulled out of the rut. In the meantime, we continue to stay stuck in neutral, bouncing around between 2030 and 2100.
NASDAQ CHART

DOW JONES INDUSTRIAL AVERAGE COMMENTARY
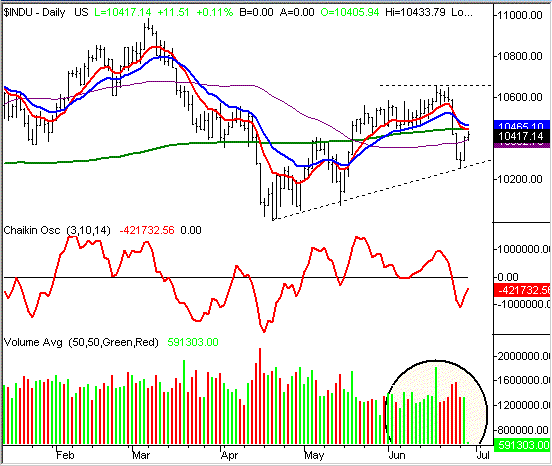
We wanted to look at the Dow Jones Average today specifically because it's done something more than a little noteworthy. The Dow is the only major market index under the 200 day line (green). It's been there for four days now, barring a move above 10,445 today (which we don't think will happen). Yes, all stocks took hits last week, so a falling Dow wasn't a major concern. The concern is how the Dow got in such a weak position in the first place that a 300 point correction could spark a long-term sell signal. The answer is that the Dow didn't participate in the May rally in a significant way. We'd be the first to acknowledge that the nature of these large-cap blue chips prevents them from explosive breakout (bullish or bearish), but it doesn't change the fact that investors are clearly scaling out of names that are traditionally very reliable.
The interesting part is that, relatively speaking, the NASDAQ turned weaker than the S&P 500 and the Dow this week (based on momentum). If you're stronger indexes are already under the 200 day line, how much longer will the weaker ones manage to stay above theirs?
One could make the case the Dow Jones Industrials are poised to recover, unwinding the sell signal made last week. A support line was defined with Monday's low of 10,253, and the index has gotten back above its 50 day line today. But now it faces resistance at the converged 10 and 200 day lines, at 10,445. Today's high is 10,434, so the buyers are knocking on the door. The problem is, there just aren't enough of them. The volume yesterday was no greater than Monday's, and was much less than the selling volume we saw most of last week.
Like the NASDAQ, the Dow is just stuck in the mud - largely because nobody really wants to do anything until Greenspan speaks on Thursday. It's an understandable decision, but a little pointless. With consumer confidence coming in high, and GDP being better than expected, there's no reason not to think we won't see the Fed stay on the path of 'measured' rate hikes. It will probably be a quarter of a point again. That said, don't get bogged down by the guessing game. We're far more interested in how the market responds to what the Fed decides. Several months ago we were seeing the market buy on good news as well as bad. The last few weeks, though, it seems like investors are looking for any excuse to sell, whether it be good or bad news. By Friday afternoon, it should be pretty clear which direction investors are going to push the market. With oil pushing $60 per barrel and an alarming amount of complacency (low VIX), we think the rug could get pulled out from beneath the bulls.
Resistance is at 10,445 and 10,656. Support is at 10,392 and 10,270. Until we break free from those bounds, expect more choppiness.
DOW JONES INDUSTRIAL AVERAGE CHART - DAILY

BOTTOM LINE
Yesterday was impressive, but note how there's no follow-through. One thing we didn't mention above was the fact that the indexes had a real shot at making new highs last week, and didn't. That speaks volumes about what investors are thinking. And as more time passes through the summer, the more these charts look like last year's charts. We were back and forth then too. If history repeats itself, we're due for one more good, sustained downtrend before we start to gear up for the year-end strength. That could mean a bearish July and August. In fact, we're starting to see some bearish sector rotation on top of the NASDAQ's relative weakness. But as we stated above, the response to Greenspan's words will be the key.
Price Headley is the founder and chief analyst of BigTrends.com.