NASDAQ Commentary
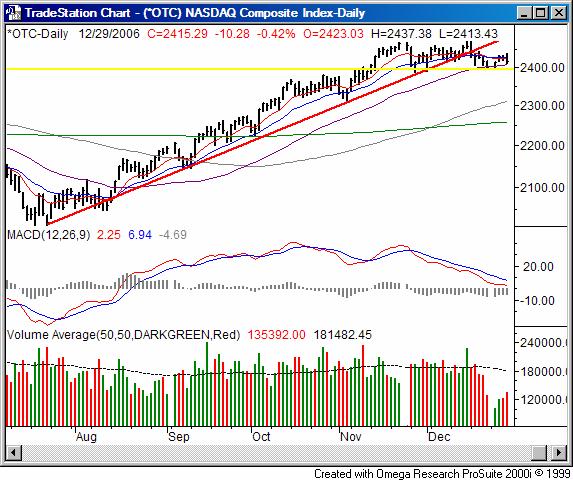
The NASDAQ's 10.28 point loss - a 0.42% dip - on Friday left the index at 2415.29 for the week and the year. For the week though, the index closed 0.59% higher (+14.11 points), thanks to a very bullish Tuesday and Wednesday. The problem is, the more recent development (Thursday and Friday) was bearish, and on higher volume. On the other hand, the end of the calendar year can do strange things.
Although what the new year will bring is practically a coin toss, we still have to use where we are now to get some sort of idea about where we're going next. Clearly the long-term support line (red) is still breached. This bigger-picture look is bearish, and has been for eight days. For that matter, the NASDAQ has been flat since mid-November. The MACD lines actually say things are bearish.
The last bastion of hope is the 50-day moving average line (purple), at 2408. It's just a few points below Friday's low of 2413. However, we'll stick with 2394 as the final line in the sand. It's tagged many of the recent short-term lows, including the one from last week. A close under that level would inherently include a close under the 50-day line, as well is flag a likely breakdown for the composite.
If we do see things start to crumble, a move all the way down to the 100-day line (grey) at 2311 is possible, or maybe even a slide to the 200-day line (green) at 2258. But as we said, we first have to see that short-term support break.
NASDAQ Chart - Daily

S&P 500 Commentary
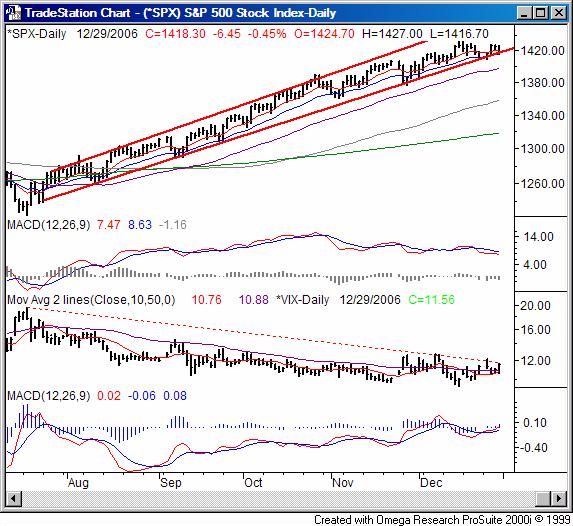
The S&P 500 closed at 1418.30 on Friday after losing 6.45 points (-0.45%). On a weekly basis, the SPX still managed to keep 7.55 points worth of Tuesday's and Wednesday's gains, closing 0.54% above last Friday's close. This index is still within its long-term bullish zone, but is under some serious fire.
Going all the way back to July, you can see the upward channel (framed in red) that has gently guided the large-cap market higher. The lower edge of that zone is currently at 1416. Friday's low for the S&P 500 was 1416.70. Obviously the support if that zone is being tested, and it wouldn't take much of tumble to change things drastically, a couple of closes under that line would do the trick. This should be the biggest worry for the bulls.
Simultaneously, the VIX appears to be working on a break past some resistance of its own. It took a pretty good swing on Friday, but was ultimately capped by a resistance level (red, dashed) that extends back to July. A move above 11.65 would indicate that the VIX was finally moving higher, although a close above 12.68 (the VIX's peak from December 7) would be an even better confirmation. The MACD chart immediately below the VIX is actually a MACD of the VIX, and you can see how it's trying to work its way upward.
There may be a secondary support area around the 50-day line (purple) at 1398. It's just far enough below the current level to allow a 'big enough' drop to relieve some overbought pressure, although it wouldn't necessarily have to be 'big enough' to do so. In other words, we don't know what's going to happen there, but we do think whatever happens threw will be significant.
In the meantime, that support line has not been technically broken yet. With the new year literally here, anything can ands probably will happen.
S&P 500 Chart - Daily

Dow Jones Industrial Average Commentary
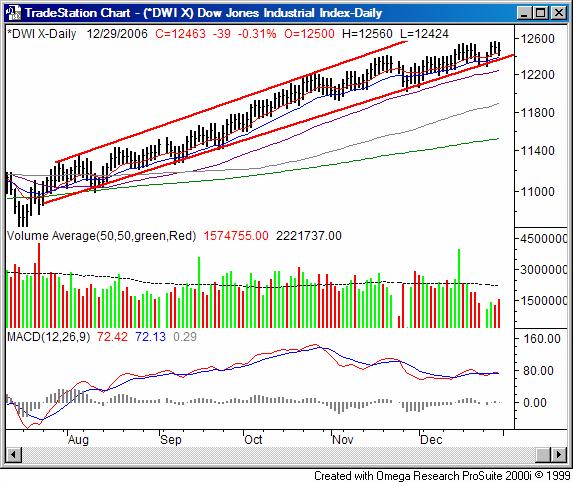
The Dow closed 39 points lower on Friday, losing 0.31% to end the day at 12,463. For the week, that meant a 120 point gain, leaving the blue-chip index 0.97% above the prior week's close, the best showing of all three indices.
Since the Dow's chart is basically a mirror image of the SPX's, we won't rehash that here. Instead, well just remind you it's far better to act upon what the market is doing rather than what we think it should be doing. Whatever may come on Wednesday (markets are closed Tuesday too, in honor of Gerald Ford), we think January could provide some great trading volatility.
Dow Jones Industrial Average Chart

Price Headley is the founder and chief analyst of BigTrends.com.