NASDAQ Commentary
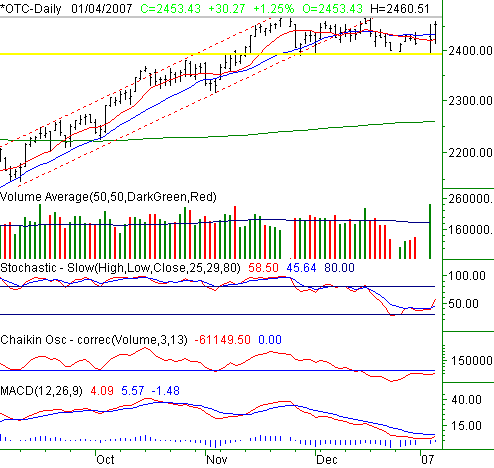
The NASDAQ Composite knocked it out of the park on Thursday, gaining 1.25% (+30.27 points) to end the session at 2453.43. As you'll read below, that's leaps and bounds better than the other two indices we track. Of course, a closer inspection will reveal that Google (GOOG) was one of the main reasons we got such a move here - GOOG shares were up 15%. But still, the vast majority of the composite's biggest names were up firmly.
And what's next? The rally pulled the index back above the 20-day line, but it still may be a little premature to say the bullish spring is coiled. Friday could be a big test.
We've been honing in on a major support level around 2394, still marked in yellow on the chart. Apparently somebody was listening, as that level came into play on Wednesday when the rebound was started. The follow-through was clear on Thursday. It goes without saying, then, the potential bearishness that could be sparked with a close under 2394 is still only an unrealized possibility. The trigger is still there, but for now we can't get bearish because it's not failed as support.
On the flipside, don't get too excited about any possible upside move - there's still that nagging resistance line (gray) at 2470. Only a close or two above there would confirm bullishness to us.
So then, what we're left with are the technical indicators. Taking them at face value leaves us with an almost bullish outlook.
The stochastic tool is already full-blown bullish. The Chaikin line will be bullish if/when it crosses above zero. The MACD line will be bullish if/when we get a positive cross (red over blue).
How we're viewing things here is actually pretty simple. Odds are that a confirming MACD or Chaikin line bullish cross will coincide with the NASDAQ's move above 2470. So, the signal and a confirmation may end up occurring on the same day.
With all that in mind, be patient. Friday may well be the day it happens. If we close out the week strong, we'll be looking for more of the same buying next week.
NASDAQ Chart

S&P 500 Commentary
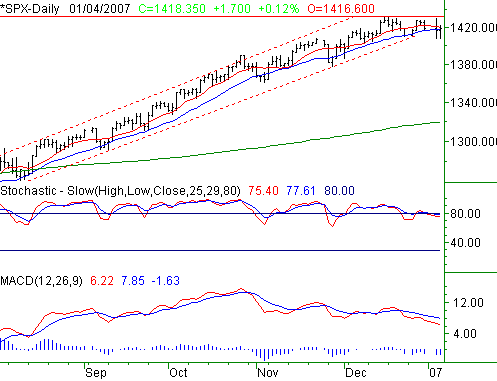
On Thursday, the S&P 500 managed to scrape up a gain of only 0.12%, or 1.71 points (despite the fact that Google is indeed part of the S&P 500). Yet, it's not like the bears have taken control over the last four lackluster sessions. The SPX is still finding support. However, the SPX is also finding resistance. The sideways zone that's been holding the index steady is becoming pretty clear on our chart. And, we suspect those same support and resistance levels will be the key to figuring out where things are headed next.
Our honest assessment of the SPX chart can be boiled down to one basic idea -- hanging on by a thread. On a closing basis the 10- and 20-day averages are still acting like support. But on an intra-day basis, they're not.
The challenging part here is the difference between the SPX's indicators and the NASDAQ's. For the S&P 500, the chart says we were overbought until a few days ago, but are just now starting to correct the problem with a pullback. The notion is confirmed by stochastic lines now under the 80 threshold, and yet another bearish MACD cross. (The NASDAQ, in comparison, looks as if it's coming out of an oversold condition by starting a rally.)
As far as how to handle it, we're still waiting to see. It would take very little to drive the index as far under the 10- and 20-day averages (red and blue) as they've been in months. If investors get spooked by that, the market's vulnerability could be exposed in a hurry, as we slide all the way back to the 200-day line (green) at 1320.
However, we can't assume anything. As it stands right now, the uptrend is still intact. Of course, the safer (wise?) move may be to see if we can get past the recent high of 1432 before digging in too deep with long trades. Friday will be a big day, although we don't expect to get much clarity for this chart until early next week.
S&P 500 Chart

Dow Jones Industrials Commentary
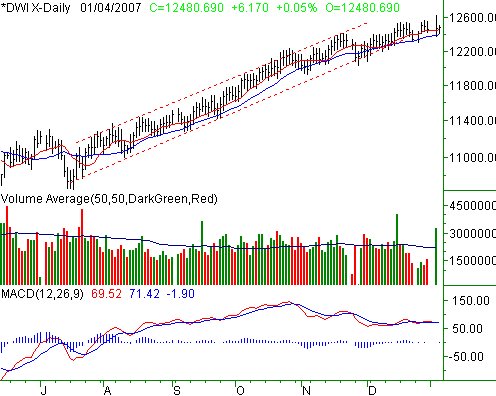
The Dow Jones Industrials' performance was even more marginal than the S&P 500's; the Dow only gained 0.05%, or 6.17 points, to end the day at 12,480.69. But, like the SPX, the uptrend is still technically alive even if it's sleeping. How so? The key moving average lines are still keeping the blue-chips aloft -- inching higher.
Despite Thursday's lagging performance, the Dow still remains the most technically sound chart we watch. It's finding good support at the 20-day average line (blue), and has had no major problems with reaching new all-time highs (like Wednesday's high of 12,630 was).
Dow Jones Industrials Chart

Price Headley is the founder and chief analyst of BigTrends.com.