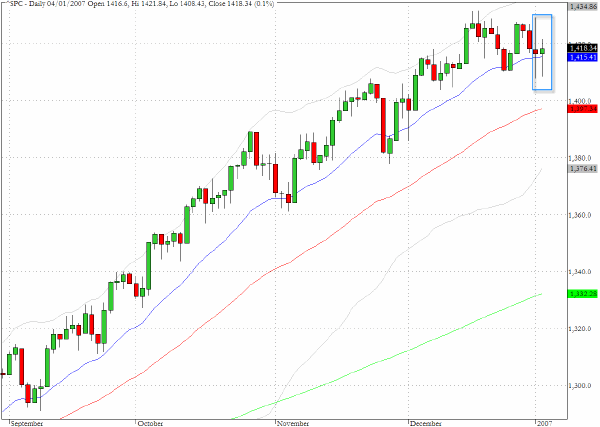
Given the wide range session on Wednesday it was not too surprising to see the S&P 500 index (^SPC) registering an inside day in yesterday's trading. The tiny body formation resulted in the second consecutive spinning top candlestick formation and highlights the cautious and tentative tone that is arising from the conflicting interpretations of current economic data.
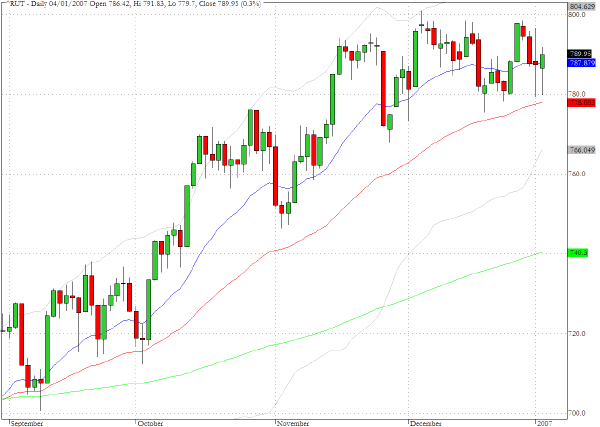
Despite good gains for the Nasdaq Composite (^IXIC) and the Nasdaq 100 (^NDX) in yesterday's action the Russell 2000 (^RUT) put in a relatively restrained performance. Notably the intraday low was just above Wednesday's low and another inside day was registered.
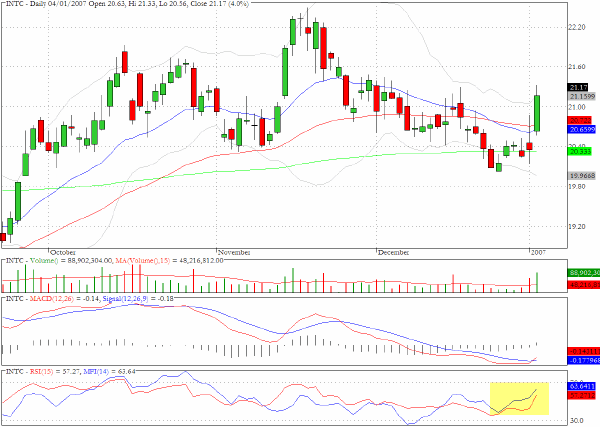
The major feature of yesterday√Ę‚,¨‚"Ęs trading was the strong showing from some technology stocks which helped the Nasdaq Composite to record a 1.5% gain as the standout performer for the day. Intel (INTC) which managed a four percent gain (see below) was one of the major contributors to the gains but elsewhere in the semiconductor sector there was an inconsistent performance.
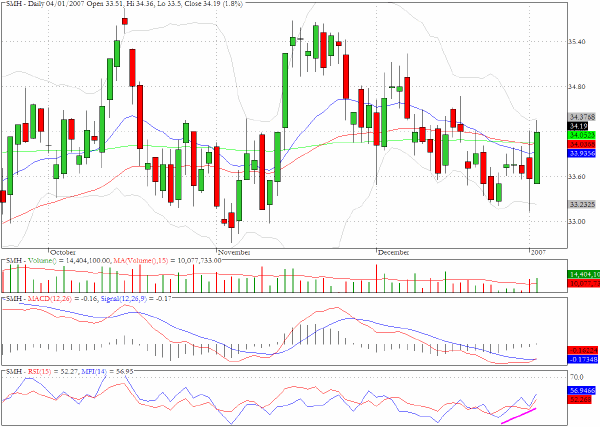
The exchange traded semiconductor sector fund SMH has been range bound since September and while the chart looks constructive we would want to see a definite assault on the upper boundary of the range before celebrating a new upward leg for the techs.
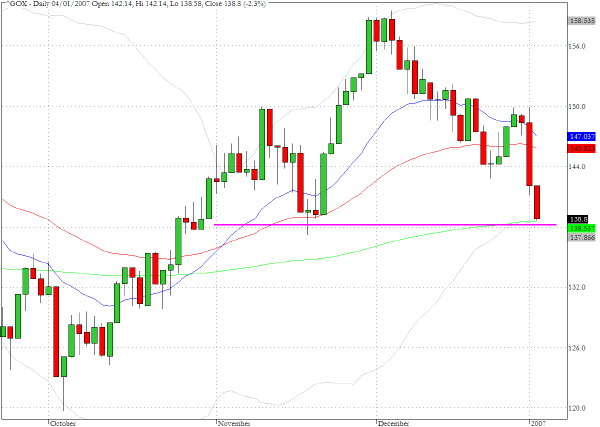
The CBOE Gold index (^GOX) continued its downward trajectory yesterday and the index has lost more than 12% since early December with half of that loss occurring in the last two sessions. The index came to rest at a potential chart support level which also coincides with the 200-day EMA. A similar pattern can be seen on the chart for Newmont Mining (NEM).
TRADE OPPORTUNITIES/SETUPS FOR FRIDAY JANUARY 5, 2007
The patterns identified below should be considered as indicative of eventual price direction in forthcoming trading sessions. None of these setups should be seen as specifically opportune for the current trading session.
Intel (INTC) moved up 4% on almost twice the average daily volume. The momentum and MFI charts appear constructive and the next target would seem to be the mid November highs just above $22.30
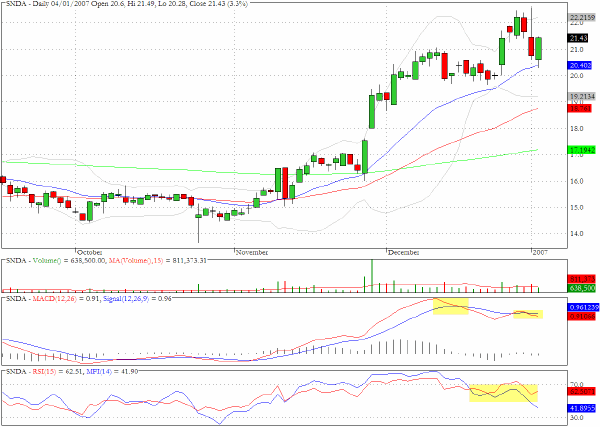
Shanda Interactive (SNDA) has negative divergences on both the MACD and MFI charts.
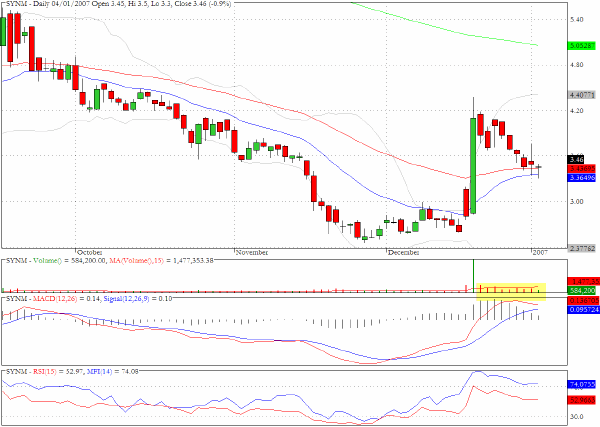
Syntroleum (SYNM) has pulled back towards potential support following the long green candlestick on December 19th. As the highlighted section of the volume chart indicates the pullback has been accompanied by relatively subdued volume. In particular yesterday's volume was less than half of the average daily volume. This stock is not for the faint hearted and whipsaws are to be expected but the next upward movement could be sudden and substantial.
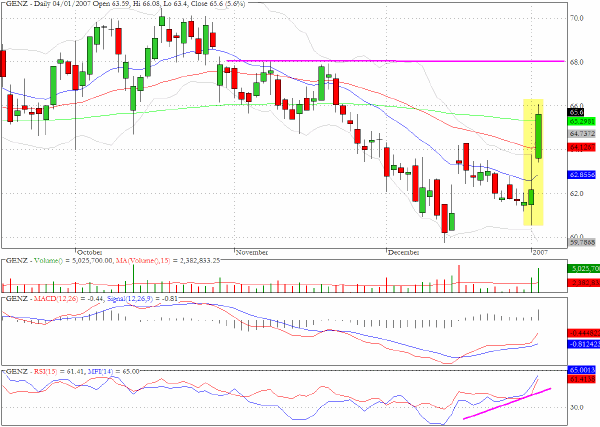
Genzyme (GENZ) was one of the biotech stocks that surged yesterday and the momentum suggests that targets at both $68 and $70 could be tested in the near future.
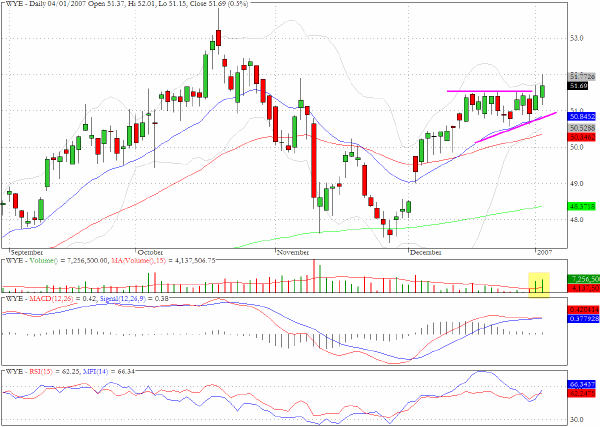
One of the stocks we cited yesterday Wyeth (WYE) continues to present a potential breakout pattern.
Clive Corcoran is the publisher of TradeWithForm.com, which provides daily analysis and commentary on the US stock market. He specializes in market neutral investing and and is currently working on a book about the benefits of trading with long/short strategies, which is scheduled for publication later this year.
Disclaimer
The purpose of this article is to offer you the chance to review the trading methodology, risk reduction strategies and portfolio construction techniques described at tradewithform.com. There is no guarantee that the trading strategies advocated will be profitable. Moreover, there is a risk that following these strategies will lead to loss of capital. Past results are no guarante of future results. Trading stocks and CFD's can yield large rewards, but also has large potential risks. Trading with leverage can be especially risky. You should be fully aware of the risks of trading in the capital markets. You are strongly advised not to trade with capital.