NASDAQ Commentary
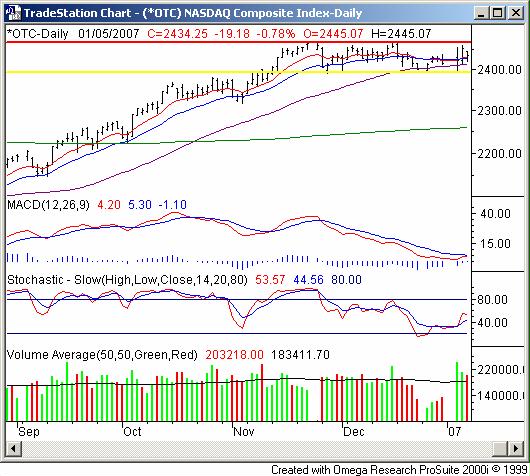
The NASDAQ ended the shortened week at 2434.25, losing 19.18 points on Friday (-0.78%), but still gaining 18.96 points (+0.78% for the three session week. As far as any sort of decisive move - in either direction - we'd have to say there wasn't one. Instead, the composite seemed content to hover right around its recent range, and stay within the confines of what is becoming a long-term flattened channel. As such, we're still on the sidelines about what to think of the NASDAQ.
What's bullish? For starters, note the support that the index has found at the 50 day moving average line (purple). Simultaneously, note the support we've seen from the lower edge of the sideways channel (yellow) that's been in place since November. Granted, finding support doesn't have to mean things are bullish - it just means things aren't sinking. However, 'surviving' a period that should be corrective (at least to many traders) can be bullish in the sense that it buys time until the bulls are ready for another round.
Besides that, you'll see how we're right on the verge of a MACD crossover, and we're already into a stochastic buy signal.
What's bearish? In a word, Friday. Investors didn't want much to do with stocks just before the weekend came -a subtle sign that they're not overly interested in holding them in general. Plus, it's clear the pace of gains we were enjoying late last year is no longer the same pace we're experiencing now. In fact, there is no 'pace' to speak of...things have been flat for weeks now. While a flat market is no more bearish than bullish, it's also no more bullish than bearish. The longer the market stays stagnant, the greater the possibility that any buyers will lose interest altogether (the other side of the coin we discussed in the 'what's bullish' commentary).
So like we said on Thursday, the NASDAQ's chart is basically putting us on hold. What we're waiting for is a break under support at 2394, or a break above resistance at 2470. In the meantime, it looks like we're just stuck in the range.
NASDAQ Chart - Daily

S&P 500 Commentary
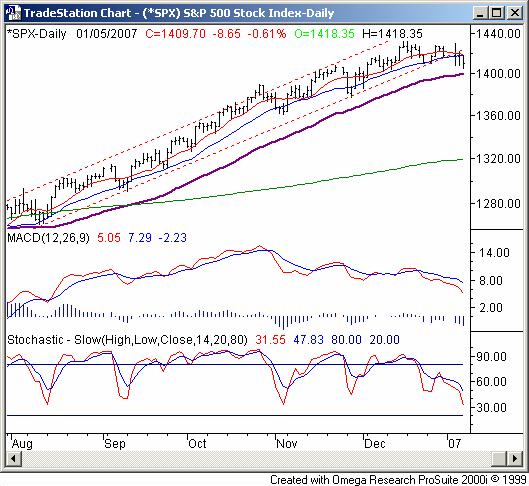
The S&P 500's 0.61% dip on Friday - a pullback of 8.65 points - left the index at 1409.70 for the week. That was the sole culprit for the week's loss of 8.6 points, with the SPX closing 0.61% under the prior Friday's close. While that in itself may not be disastrous, it was actually a good week for a lot of bearish firsts in a long time. Based on the SPX's lead, the bears seem to finally be taking control. Of course, the SPX doesn't always lead.
What are the bearish firsts we're talking about? The most obvious one is the break under that long-term support line (red, dashed) for the first time since the rally started in July. However, Friday was also the first time that the 10 day average line (red) has touched the 20 day average line (blue) since July as well. On a secondary note, this is also the closest we've been to the 50 day average line (purple) since July. For that to happen, clearly something has to be different in a less-bullish way.
Neither are firsts, but you'll also see a bearish MACD chart as well as a bearish stochastics chart - which is completely at odds with the same tools for the NASDAQ chart. Hence, our hesitation in making a firm call. However, based solely on the S&P 500 chart, we'd have to say the tide is turning in favor of the bears.
The disparity also brings up the argument about leading and lagging indices. In general, the NASDAQ leads the rest of the market - both up and down. If that really is the case right now, then theoretically the SPX should follow the NASDAQ higher soon. After all, the NASDAQ actually made a nice gain last week. However, the recent charts call the leadership notion into question. The SPX is technically breaking down, while the NASDAQ is treading water. As of now there are no certain answers, but we'll be looking at this theme in more details as the story unfolds. We may have a better picture by the end of next week.
S&P 500 Chart - Daily

Dow Jones Industrial Average Commentary
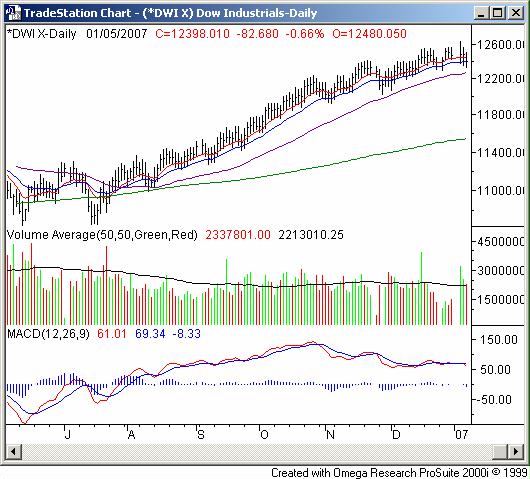
While the Dow's 0.66% loss on Friday seemed relatively big, it didn't really inflict much damage on the chart. The close at 12,398.01was 82.68 points under Thursday's close, but only 65.14 points under last week's close. The Dow lost 0.52% for the three-day trading week, though the blue-chip index is still not in the same apparent trouble the S&P 500 seems to be in.
For the Dow, let's use the 50 day line as the final line in the sand. It's at 12,269 right now (purple); a close under that would confirm any further bearishness was in store. Any cross back above the 10 day average (red) at 12,440 would have to be bullish, as it has been for months.
On the flipside, note that we've seen fourth bearish MACD cross since October, with each of them occurring at a slightly lower level than the previous one. That smacks of short-term as well as intermediate-term bearishness despite what the index itself is doing. The leadership/lagging dynamic affects - and is affected by - the Dow as well, so we look forward to seeing how it may take shape in the first month of this new year. More on that later.
Dow Jones Industrial Average Chart

Price Headley is the founder and chief analyst of BigTrends.com.