The behavior of the indices on Friday was a mixed bag with some interesting divergences. The S&P 500 experienced a 0.6% decline while the Nasdaq Composite showed a little less relative strength as it declined by 0.8% and both indices came to rest close to their respective 20-day EMA's. However the major casualty was the Russell 2000 (^RUT) cash index which declined by 1.8% and it closed below its 50-day EMA. This is a fairly notable underperformance by the smaller cap index and raises a cautionary flag.
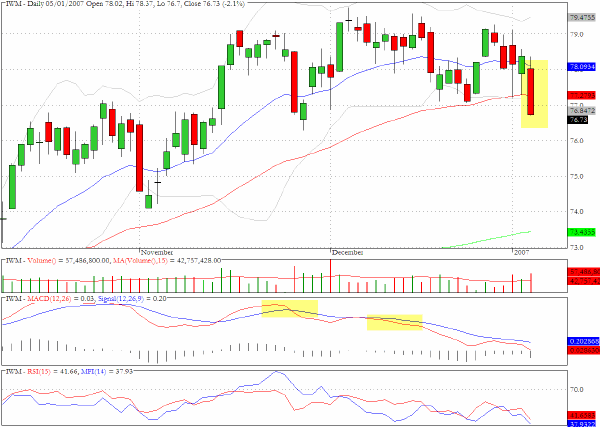
The action for the exchange traded proxy fund IWM was even more severe as the index dropped by 2.1% and as the chart reveals the 77 level was notably violated as was the 50-day EMA for this proxy. Players of the ETF's for some of the broad indices appear to be taking larger bets on declines and we shall comment below on the pick up in volume on the SDS fund which is an inverse tracker of the S&P 500.
The chart for the Nasdaq Composite (^IXIC) reveals how the uptrend since last summer was characterized by a succession of bounces off the 20-day EMA (the blue line on the chart). Each time the index made contact with this upward trending moving average it recovered to move higher. What is clearly revealed on the chart is that the blue line has switched to a horizontal mode since the second half of December.
The price action on Friday reveals an inside day and the close saw the index preserve its position slightly above the 20-day EMA. However the index has been confined below the high of 2465 registered just prior to Thanksgiving and if the index fails to penetrate this barrier in the near future this will unsettle the bulls and embolden the bears for another attempt to bring the index lower.

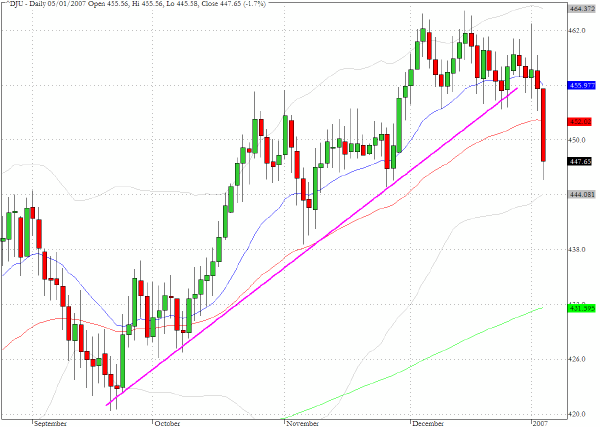
The Dow Jones Utilities Average (^DJU) saw a big downward move on Friday as the index fell by 1.7% and as the chart illustrates the violation of the trendline raises the possibility that an intermediate correction could be in the process of unfolding. There is chart support near 444 which was close to Friday√Ę‚,¨‚"Ęs close but the magnitude of the drop on Friday suggests that the sector should be watched closely in coming sessions.
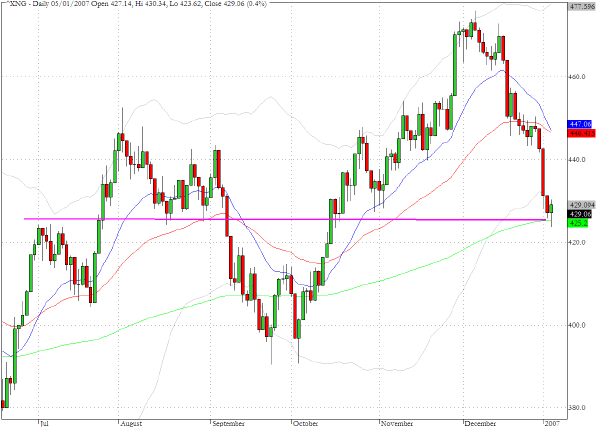
The natural gas index (^NGX) has suffered a sharp and swift correction since early December and it will be revealing to see whether Friday's closing level that is near to possible chart support as well as the 200-day EMA will hold or whether the lows of last September and early October are now back in play.
TRADE OPPORTUNITIES/SETUPS FOR MONDAY JANUARY 8, 2007
The patterns identified below should be considered as indicative of eventual price direction in forthcoming trading sessions. None of these setups should be seen as specifically opportune for the current trading session.
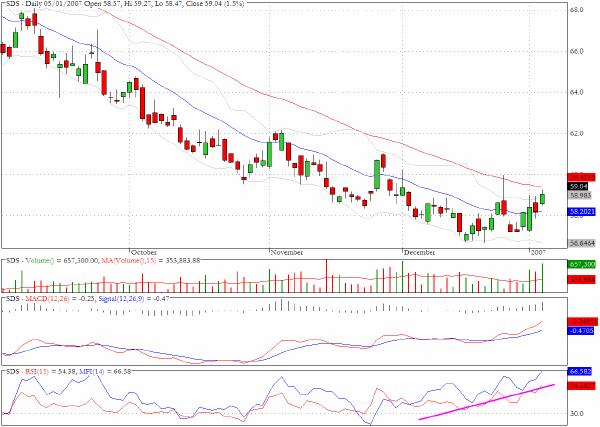
We have included the following chart for the ETF for the ProFunds UltraShort S&P 500 which tracks the index on an inverse basis. In other words it represents a play for short sellers and as can be seen the fund has been undergoing accumulation during the last month. Whether there is a contrarian flavor to this fund remains to be seen as the fund has only been trading since last July.
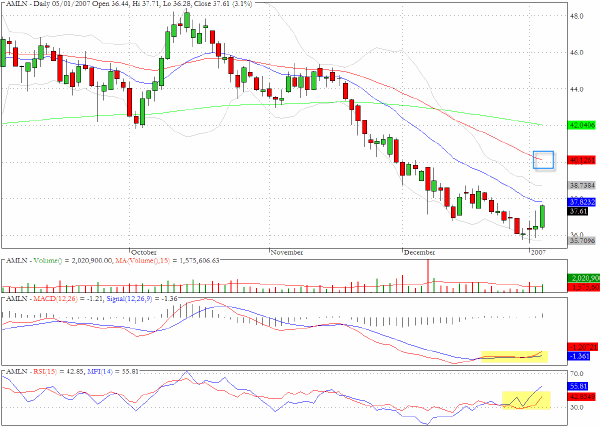
The daily chart for Amilyn Pharmaceuticals (AMLN) suggests that the stock appears to have begun a basing pattern. In the medium term the $40 level which coincides with the 50 day EMA will probably be a target but the intervening trajectory could well be choppy.
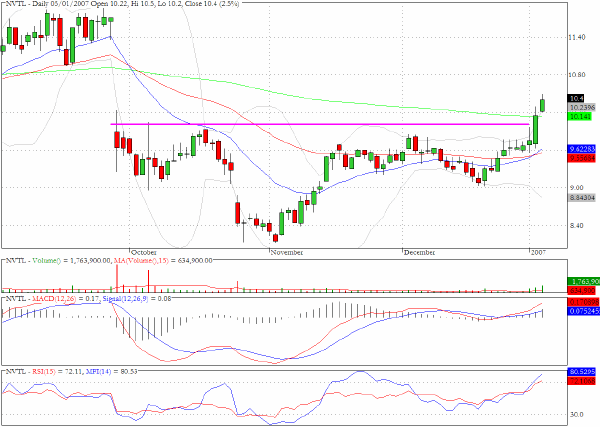
The chart for Novatel Wireless (NVTL) shows significant action on Friday as the stock pushed above its 200-day EMA on three times its average daily volume. The post gap down level/hurdle of $9.60 from late September has been crossed but the momentum and buying pressure may be temporarily overstretched so we would not chase the breakout pattern but become more persuaded if there is a pause for breath.
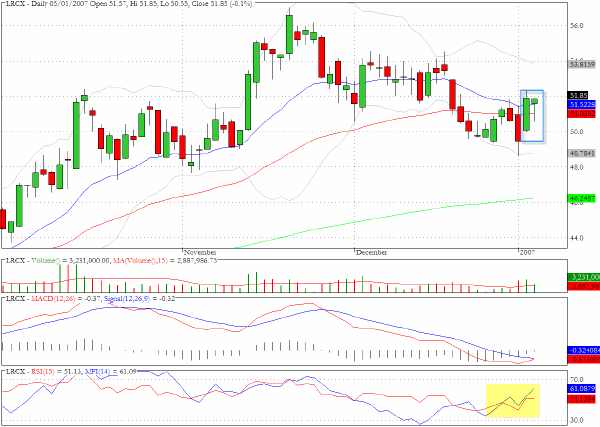
We noted in our commentary last Friday that many of the semiconductor stocks have been range bound since last summer and Lam Research (LRCX) is no exception. Some indications for the sector look positive and we would not be surprised to see upward progress for LRCX and others this week.
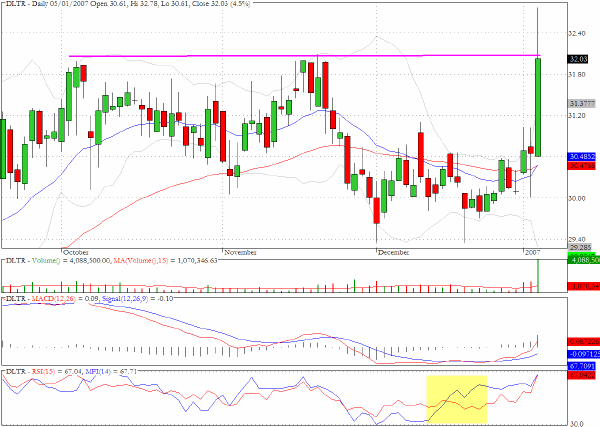
Dollar Tree Stores (DLTR) gained 4.5% on Friday on almost four times the average daily volume and in so doing rose exactly to the top of the range that extends back to early October. We have included the chart not only because the stock faces a breakout challenge but because the money flow prior to Friday's action had been building and showing positive divergences to the price action during December which should have alerted us to accumulation taking place.
Clive Corcoran is the publisher of TradeWithForm.com, which provides daily analysis and commentary on the US stock market. He specializes in market neutral investing and and is currently working on a book about the benefits of trading with long/short strategies, which is scheduled for publication later this year.
Disclaimer
The purpose of this article is to offer you the chance to review the trading methodology, risk reduction strategies and portfolio construction techniques described at tradewithform.com. There is no guarantee that the trading strategies advocated will be profitable. Moreover, there is a risk that following these strategies will lead to loss of capital. Past results are no guarante of future results. Trading stocks and CFD's can yield large rewards, but also has large potential risks. Trading with leverage can be especially risky. You should be fully aware of the risks of trading in the capital markets. You are strongly advised not to trade with capital.