After last week's market-wide losses being taken in the shadow of what was otherwise a pretty bullish latter half of 2006, it's tough to find a particular sector that was newly bullish or bearish; they all seemed to suffer about the same. However there is one particular sector of interest - it may be on the verge of a more significant breakdown than other sectors. Plus, this potential breakdown is not necessarily going to require a market-wide pullback. Keep in mind, however, that any looming pullback has yet to actually start. This is just something we think is worth putting on your radar.
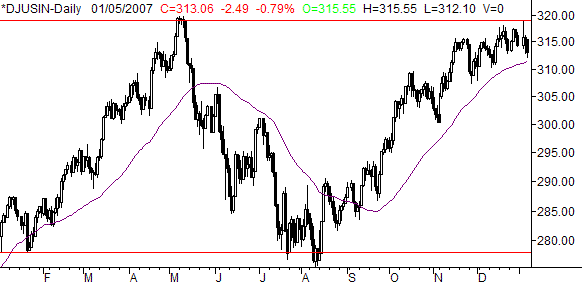
The Dow Jones Industrial Index (DJUSIN) may have just made a double top at 319. [This is not the highly used market barometer known as the Dow Jones Industrial Average.] The first instance occurred in May of 2006, right before a trip all the way back down to 275. The second occurrence - if it was indeed the second top of two - occurred early last week. The index looks like it has been weakening for a while even though it's been gradually drifting higher. But all things must come to an end, and this is possibly the beginning of the end (in the short run) when it comes to the Dow Jones Industrial Index. The potential trump card is going to be the 50-day moving average (purple) currently at 311. It will have to fail as support for this potential bearishness to actually materialize. So this is not a firm call for the time being.
Dow Jones Industrial Index (DJUSIN) - Daily

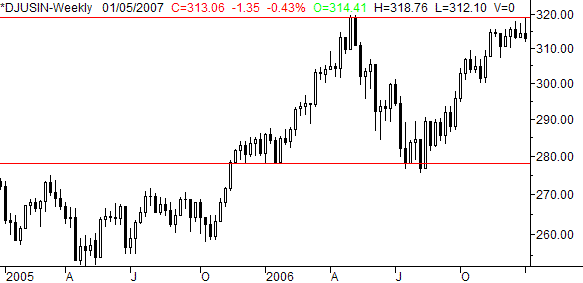
If this potential downtrend does indeed get traction, our target - like we said above - is going to be 275. That's where we ultimately landed after peaking at 319 back in May of last year. On the weekly chart you can also see that the 275 area was a bottom a few times even before that. So it's significant enough to use as a floor for now. The other thing you'll notice on the weekly chart is three consecutive gravestone Doji's. That just means that the open and close were both at the lower end of the weekly range. Simultaneously it means that we saw a mild buying effort at some point in time in the middle of the week, but the bulls couldn't hang on to those gains. In the end, the bears won out. The third of the last three weekly bars is particularly telling as it is an outside bar altogether. That just means we saw a higher high, then a lower low, and then the lowest close we've seen in over a month. In other words, the bigger picture trend is bearish, even if not overtly apparent just yet.
Dow Jones Industrial Index (DJUSIN) - Weekly

On the flip side, this is a very tentative call. If for some reason things improve soon and we crawl back above 319, then obviously this bearish look is going to be negated. In either case, we expect to see one scenario or the other take shape at some point in time this week. If it does turn out to be the downside move, it's probably going to be trade-worthy.
Price Headley is the founder and chief analyst of BigTrends.com.