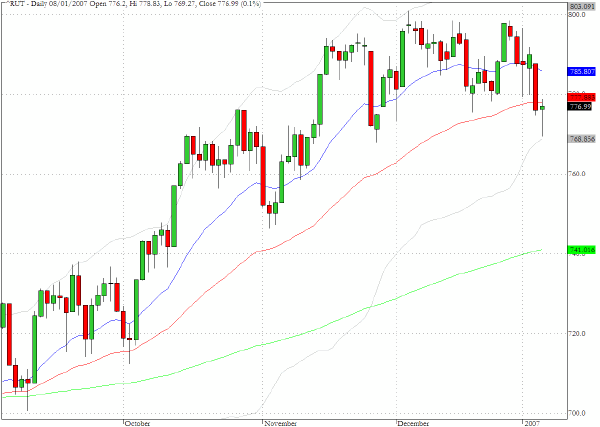
The Russell 2000 (^RUT) continued to explore lower prices during trading yesterday following Friday's noticeable underperformance. The low for the day broke just below the pivotal 770 level but as the long lower tail suggests there was buying support which enabled the index to close essentially unchanged. If the index can regain its poise there is another chance for the bulls to regain control of the agenda but a break below 770 would suggest that the trend is transitioning to a corrective phase.
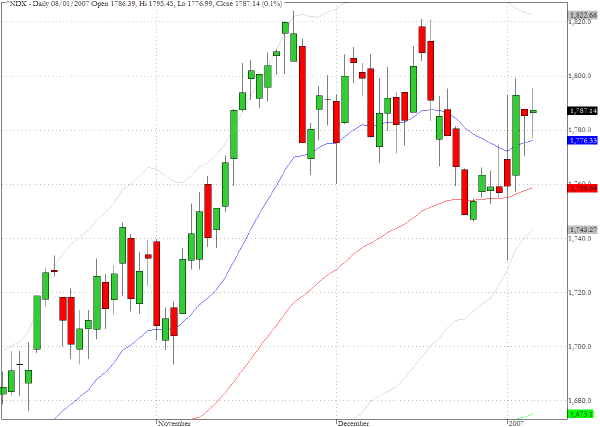
The chart pattern for the Nasdaq 100 (^NDX) is somewhat opaque. The close yesterday at 1787 is situated approximately at the mid point of the range that dates back to mid November and the Spinning Top candlestick suggests that we need to keep an open mind as to where this index wants to head next.
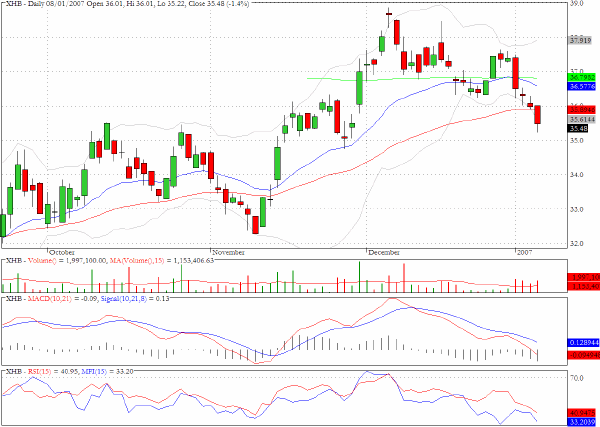
The ETF for the homebuilders, XHB, is at a fairly critical level. The close yesterday was below the 50 day EMA and this puts into question the upward breakout that occurred in late November which brought the sector back above the 200-day EMA (the green line on the chart). There is conflicting evidence regarding the longevity of the real estate downturn and those with vested interests on either side of the issue are not shy in expressing their opinions as to the long term health or otherwise of the sector.
TRADE OPPORTUNITIES/SETUPS FOR TUESDAY JANUARY 9, 2007
The patterns identified below should be considered as indicati
ve of eventual price direction in forthcoming trading sessions. None of these setups should be seen as specifically opportune for the current trading session.
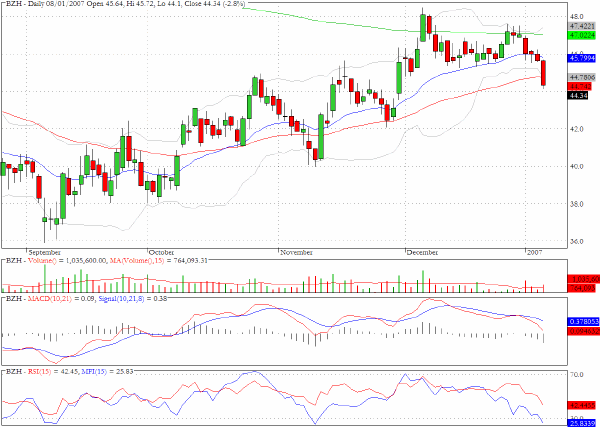
Echoing the chart for XHB that we reviewed previously the breakout above the 200-day for Beazer Homes (BZH) in December appears now to have been invalidated by the recent price action.
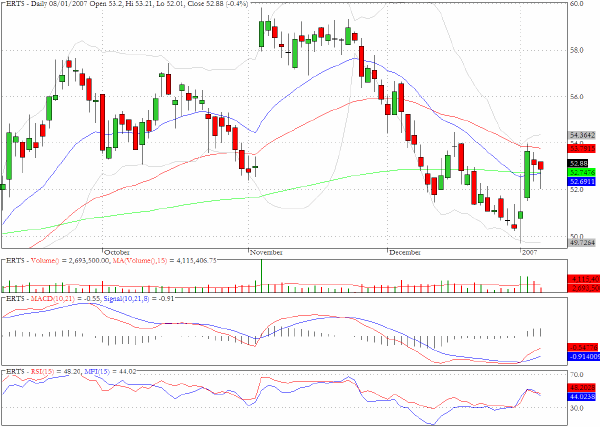
The chart for Electronic Arts (ERTS) looks constructive on the bullish side as positive divergences have been shaping up during the latter part of December.
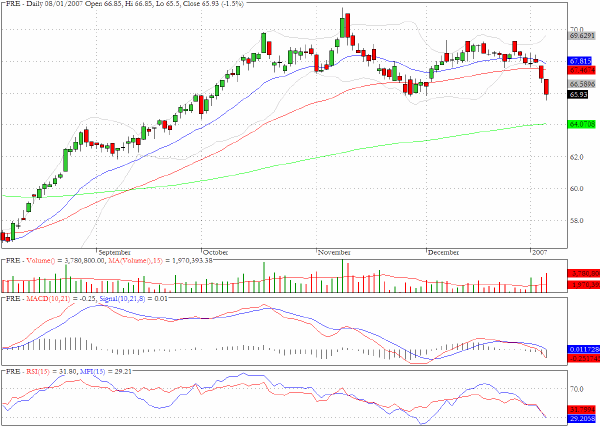
Freddie Mac (FRE) could be heading for a test of the 200 day EMA near $64
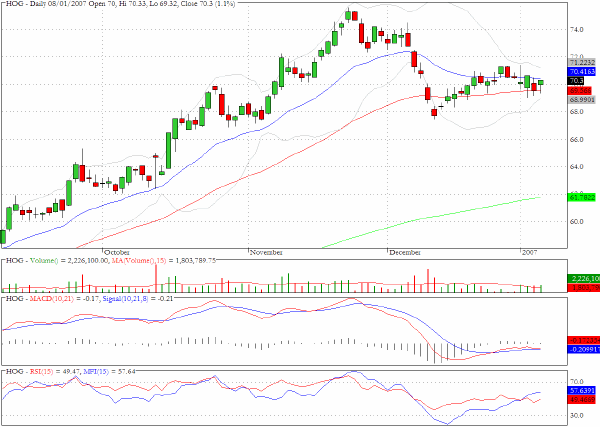
The volatility (Bollinger) bands for Harley Davidson (HOG) are very constricted and a breakout to the upside seems the most likely resolution to the pattern.
Clive Corcoran is the publisher of TradeWithForm.com, which provides daily analysis and commentary on the US stock market. He specializes in market neutral investing and and is currently working on a book about the benefits of trading with long/short strategies, which is scheduled for publication later this year.
Disclaimer
The purpose of this article is to offer you the chance to review the trading methodology, risk reduction strategies and portfolio construction techniques described at tradewithform.com. There is no guarantee that the trading strategies advocated will be profitable. Moreover, there is a risk that following these strategies will lead to loss of capital. Past results are no guarante of future results. Trading stocks and CFD's can yield large rewards, but also has large potential risks. Trading with leverage can be especially risky. You should be fully aware of the risks of trading in the capital markets. You are strongly advised not to trade with capital.