NASDAQ COMMENTARY
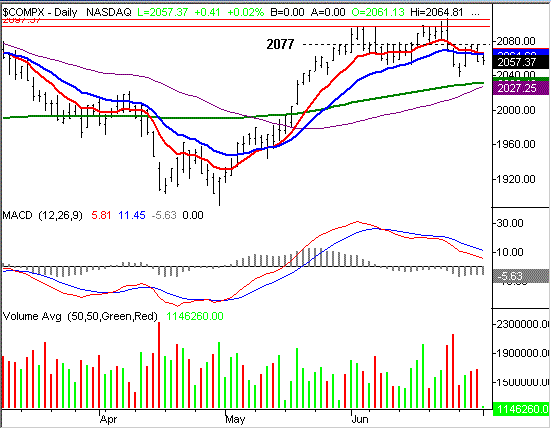
The NASDAQ Composite may have finished higher for the week, but it was far from impressive. With the exception of Tuesday's big 25 point rally, the sellers were pretty much in control. That's the third losing week out of the last five, even though it just seems like stocks are stuck in neutral right now. The reality is that, since May 27th, the NASDAQ is about 20 points lower. No, that's not a lot, but all big pullbacks start as small, subtle dips. And based on our current chart, the odds favor this selloff being extended before we recover.
In the MidWeek Update we were eyeing resistance at 2100, but we were really keyed in (in the short-term) on the resistance established at 2077 (dashed). That resistance ended up holding. The highs from Wednesday and Thursday just brushed that area, and both times, stocks fell back. By Friday, the bulls didn't even bother making an attempt. In fact, on Friday, the NASDAQ couldn't even muster enough buyers to stay above the 10 and 20 day lines (red and blue). Those two lines, both at 2065, acted as resistance on Friday, so now we've got another barrier to add to the one at 2077.
Technically speaking, none of this is a surprise. The MACD lines turned bearish on June 9th. And as of this week, the volume tipped in favor of the bears as well.
The next milestone (and potential support) is the 200 day average at 2032. By the time that becomes an issue, the 50 day moving average line will be right there as well to augment the potential support. That's only 23 points away, though, so soon we'll have a much better idea of whether or not the bulls are looking to buy in a dip. Based on the fact that the NASDAQ is actually the weakest index right now, and the fact that the Dow is already under its 50 and 200 day lines, we're looking for the NASDAQ to not find support there. All the same, it may be worth the short wait to find out for sure. If the support at 2032 ends up being broken, there will be plenty of room for a big downtrend. Once it starts, the selling may not stop until we get to this year's low of around 1890.
NASDAQ CHART

S&P 500 COMMENTARY
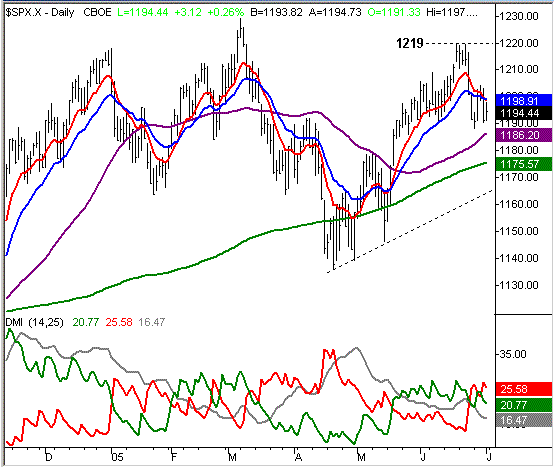
There's not a lot to say about the S&P 500 that wasn't said about the NASDAQ. For the week, the index may have wound up in the positive territory, but it wasn't pretty. The S&P has fared a little better than the NASDAQ over the last five weeks though, closing higher in three of them. But similar to the NASDAQ, after getting to 1200 in late May, the large-cap index now finds itself under that level. This week's close was only about seven points under that mark, so no big deal, right? Well, yes and no. The close at 1193 is 26 points under the 1219 mark reached two weeks ago. In other words, the SPX's weakness has all come in the last several days.....the NASDAQ's weakness has been slow and grinding.
In any case, the S&P has some bearish patterns worth a look. The biggest one we see is the cross of the 10 day average (red) under the 20 day line (blue). This is a pattern that has actually yielded pretty good results lately, so we're paying a little extra attention to it now. With the exception of the fakeout crossovers in early May, all of the 10/20 day crosses have accurately signaled a pretty good-sized move (Jan. 10th, Feb. 4th, May 17th). And even the fakout from early May eventually panned out, so, we're giving this crossover from Friday a lot of credence. Plus, it doesn't hurt the bearish argument to see resistance at the 10 and 20 day lines too.
There's a lot of potential support for the S&P 500 though. The 50 day average and the 200 day average are at 1186 and 1175, respectively. And after that, there's secondary resistance (dashed) around 1165. But, both the 50 day and 200 day averages have been shaky at providing support or resistance this year (for the S&P anyway), so we're not expecting much form them this time around. This years lows around 1140 are still the more likely bounce point if this pullback solidifies the way we think it will.
S&P 500 CHART

DOW JONES INDUSTRIAL AVERAGE COMMENTARY
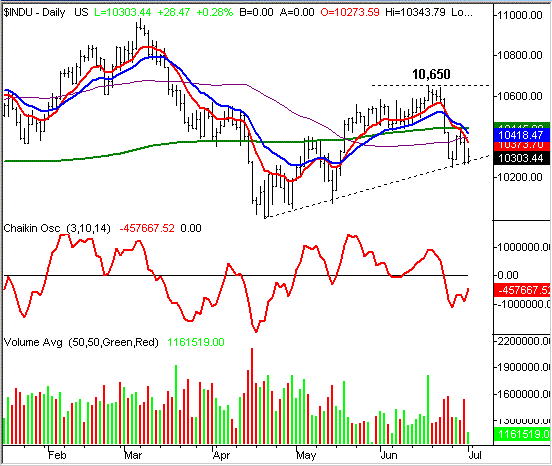
The Dow Jones Industrial Average, as we mentioned Wednesday, is the only major index under the important 50 day and 200 day averages.....so far. After hitting resistance around 10,650 two weeks ago, the Dow took some major lumps over the next few sessions. Crossing under all of its key lines created a flurry of sell signal, so we're about as bearish as you can be on this blue-chip index. The Dow closed in the red three of the last five weeks, with this most recent close at 10,291 being the lowest since mid-May.
As we also said on Wednesday, the shift from bullish volume to bearish volume was very well defined (see the bottom of the chart). The result of that transition yielded yet another sell signal - the Chaikin line cross under the zero level late last week. We wanted to give this indicator some breathing room, since it had been particularly erratic the last few weeks. There's little doubt now though - the sellers are coming out of the woodwork, and they buyers can't be found.
The last bastion of hope is the support line (dashed) that extends all the way back to this year's low of 10,000. But the way the bears were beating on that line by Thursday and Friday, we expect that support to break soon as well. The most likely recovery point after that is 10,000. As we said, that's the low for the year, but it's also an important psychological benchmark that traders and investors use to justify a buy/sell decision. With the economy basically strong, that's probably the 'low' that the market is looking for as a bullish entry point.
DOW JONES INDUSTRIAL AVERAGE CHART

Price Headley is the founder and chief analyst of BigTrends.com.