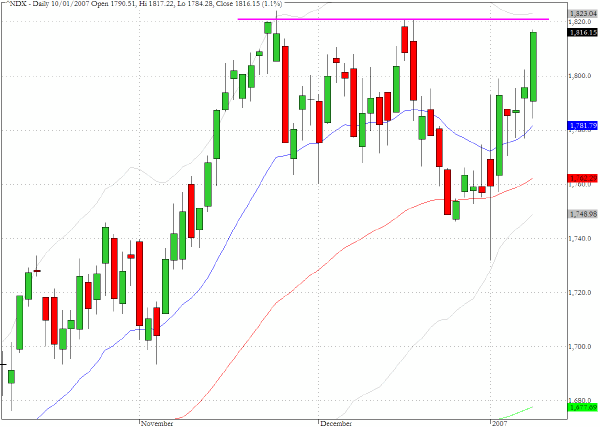
The Nasdaq 100 (^NDX) moved up 1.1% yesterday and came within a whisker of the most recent multi-year high of 1819 that was achieved on November 22. With positive developments in several big name tech stocks and with assistance from the semiconductor stocks (see below) the divergences that were causing some concern during December as the Nasdaq stocks continued to underperform seem to be fading. But we still would remain cautious about celebrating a new leg up until we see how stocks like INTC and others among the semiconductors behave as they attempt to break above upward range barriers.
The broker/dealer sector (^XBD) closed at a new high yesterday and our general perspective is that while this index continues to act bullishly it is hard to resist the temptation that the overall market will be looking to move higher.

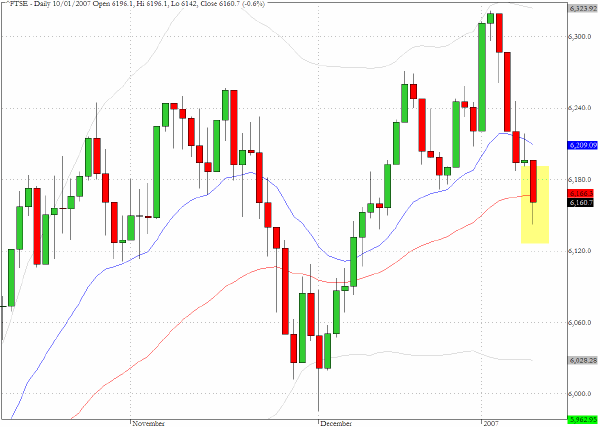
On the first trading day of 2007, the leading UK index the FTSE surged above the December range to establish a new multi-year high. With only one minor follow through on January 3rd the index has dropped quickly since and yesterday closed just below its 50-day EMA. The index is very exposed to the oil stocks and this probably accounts for the recent weakness rather than any underlying market negatives for the UK.
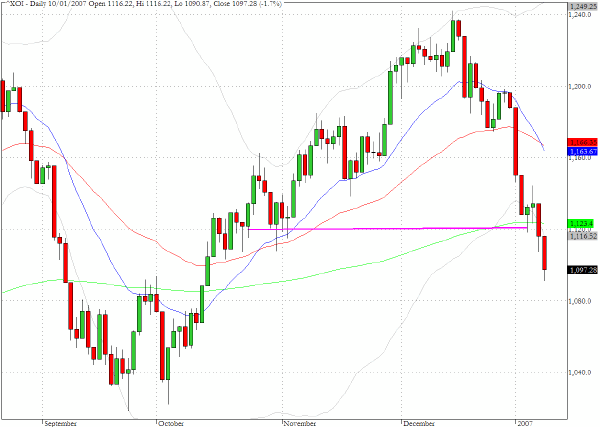
The oil index (^XOI) failed to find support in the proximity of the 1120 level which was an area of potential chart support and which also coincided with the 200-day EMA. The late September/early October levels now seem to be legitimate targets in the intermediate term
TRADE OPPORTUNITIES/SETUPS FOR THURSDAY JANUARY 11, 2007
The patterns identified below should be considered as indicative of eventual price direction in forthcoming trading sessions. None of these setups should be seen as specifically opportune for the current trading session.
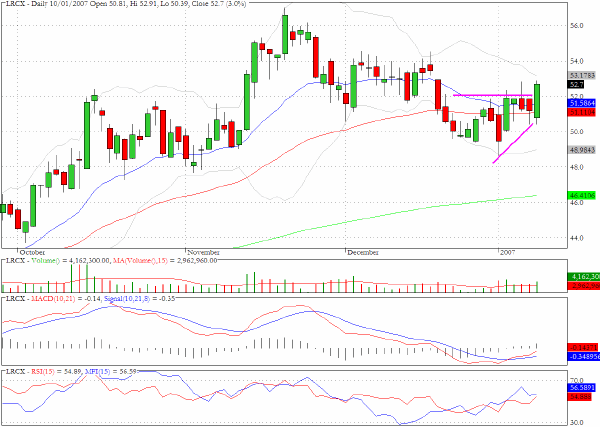
Another of our recent recommendations in the semiconductor sector Lam Research (LRCX) moved ahead by 3% yesterday out of the upward wedge pattern that we had cited and it would appear that there could be further to go as the sector seems to be headed towards a test of its upward range boundary.
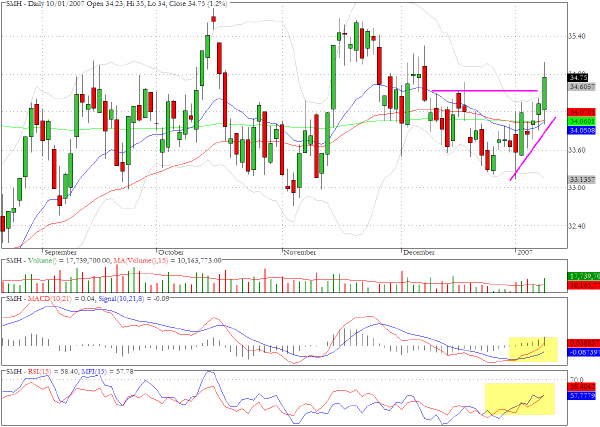
The exchange traded semiconductor fund, SMH, is showing signs that a test of the top of the range that extends back several months will be tested in coming session.
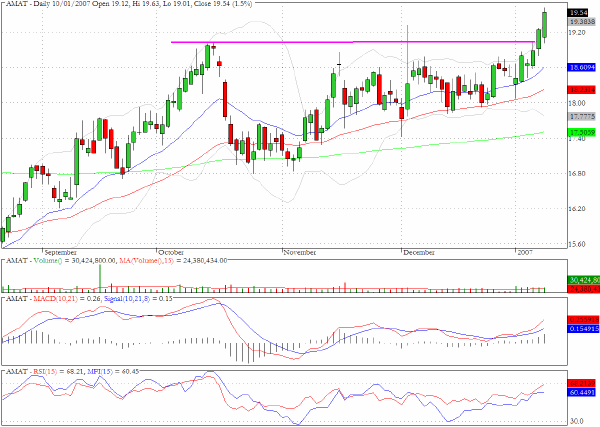
The price chart for Applied Materials (AMAT) shows a breakout pattern and the money flow shows clear accumulation but the only cautionary note that we would make is the fact that the volume is a little less vigorous than might have been expected for such a move.
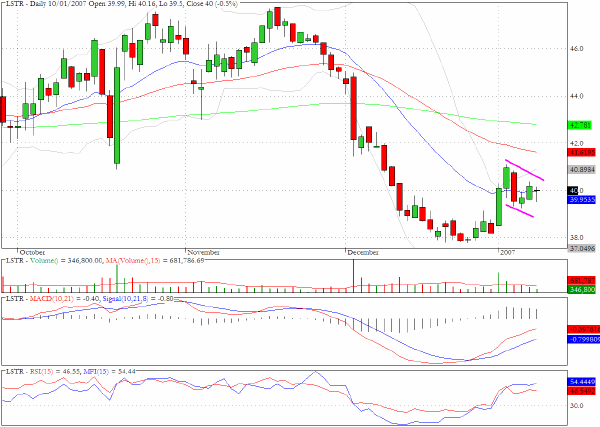
Landstar (LSTR) has a bull flag formation and the volume and money flow characteristics are supportive of a bullish posture.
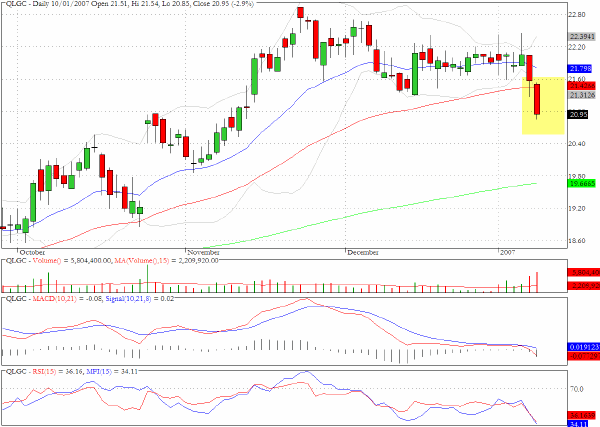
QLogic (QLGC) has seen two sessions of selling on twice the average daily volume and yesterday closed below its 50-day EMA.
Last week we drew attention to Syntroleum (SYNM) as a potential long candidate but suggested that the stock is definitely not for the faint hearted but that any upward move could be sudden and substantial. Yesterday we saw just such a move as the stock surged by more than 20% on above average volume.
We thought it worthwhile to look at the chart as it highlights the challenges that arise in trading stocks such as SYNM in particular and the bullish flag/pullback pattern in general. A possible entry point was suggested where the stock had paused at the intersection of the moving averages however this was followed by the long red candlestick that we have marked with the arrow on the chart and this would have triggered a stop loss for most position management strategies. The attrition over the sessions since the possible entry point was accompanied by very low volume and as we have also shown on the chart the technical requirements of the flag pattern were not violated as the pullback failed to penetrate below the flagpole. The rewards from these setups can be very attractive but this has to be seen in the context of the difficulty in timing entry points that do not shake you out of the position just before the big move arrives.

Clive Corcoran is the publisher of TradeWithForm.com, which provides daily analysis and commentary on the US stock market. He specializes in market neutral investing and and is currently working on a book about the benefits of trading with long/short strategies, which is scheduled for publication later this year.
Disclaimer
The purpose of this article is to offer you the chance to review the trading methodology, risk reduction strategies and portfolio construction techniques described at tradewithform.com. There is no guarantee that the trading strategies advocated will be profitable. Moreover, there is a risk that following these strategies will lead to loss of capital. Past results are no guarante of future results. Trading stocks and CFD's can yield large rewards, but also has large potential risks. Trading with leverage can be especially risky. You should be fully aware of the risks of trading in the capital markets. You are strongly advised not to trade with capital.