Quite frankly, I thought this would be the week that we'd have a confirmed sell signal in hand, and we'd be seeing volatility increase and all manner of fun things would be back for option traders. In reality, the bears fumbled the ball once again, and the bulls were only too eager to pounce on it. With today's rally, the chances of a breakdown have become minuscule. Let's review the indicators.
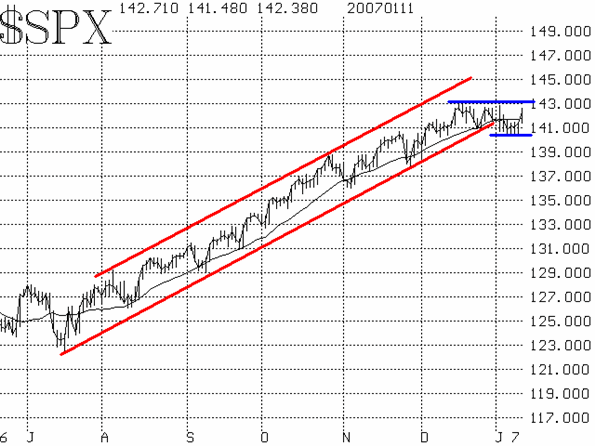
The price chart of $SPX came perilously close to breaking down. Actually, intraday $SPX did penetrate below the trendline that has supported prices since last June. But it never closed there, as it rallied into the close of trading on those days. Now, a rally has returned it into the bullish channel. A close below 1408 would have indicated a bearish breakdown -- and it still would, but it's less likely to occur now that QQQQ has advanced to 6-year highs and appears to be leading the market upward. $SPX has not confirmed those 6-year highs, as there is resistance at 1430. So, at this time, $SPX is bounded by 1408 on the downside and 1430 on the upside. A move that breaks through either one should probably be heeded -- bullish on the upside, bearish on the downside.

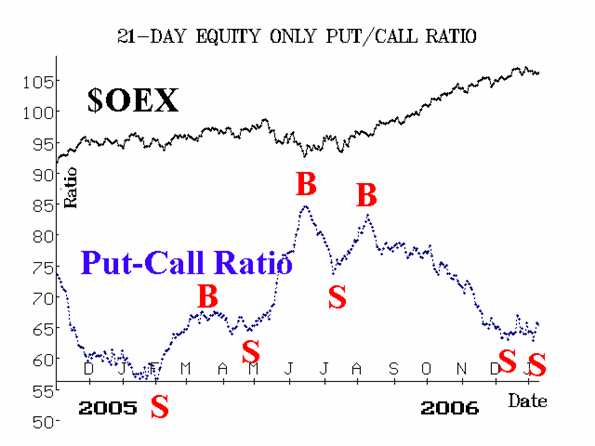
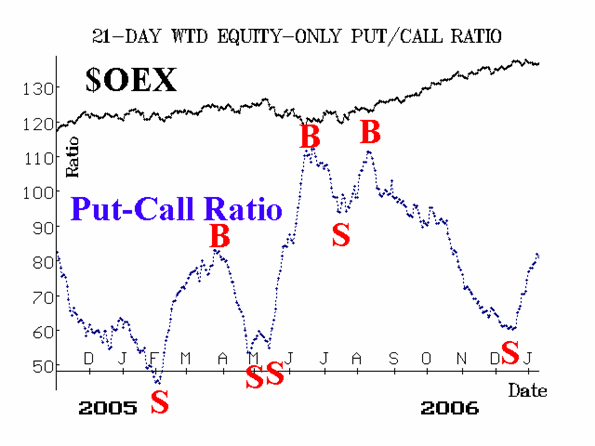
The equity-only put-call ratios have remained on sell signals through the past three weeks or so. The standard chart doesn't rise as sharply as the weighted chart, but that's because of the distortions caused by dividend arbitrage (we intend to write an article discussing how that type of arbitrage is distorting sentiment indicators). Since these are 21-day moving averages, they won't necessarily roll back over to buy signals easily, but if they do, that's the end of the bearish scenario for a while.

Market breadth (advances minus declines) has been on a sell signal since just after Christmas. But the decline in the market was so modest that breadth never got down to true oversold conditions, which might have generated buy signals.

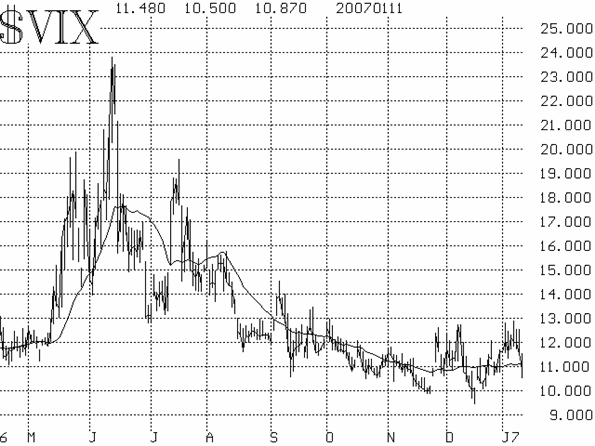
The volatility indices ($VIX and $VXO) were an excellent guide during the last couple of weeks. They basically remained bullish in that they never broke out to the upside. As it is, if $VIX closes above 12.70, that would still constitute an upside (bearish) breakout, but that seemsunlikely now. There were several days when that breakout seemed imminent, but now $VIX is back below 11 again.

Lawrence G. McMillan is the author of two best selling books on options, including Options as a Strategic Investment, recognized as essential resources for any serious option trader's library.