NASDAQ Commentary
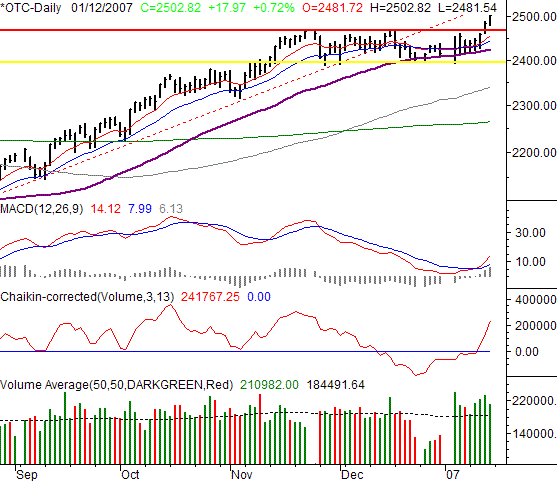
On Thursday, the NASDAQ Composite broke past that barrier of 2470, rallying all the way up to a close of 2484. On Friday, we got a bullish confirmation of that breakout when the index closed 17.97 points higher, or at 2502.82. That was 0.72% above Thursday's closing level, and 2.82%above the previous weekly close. The bottom line is that it's bullish. We'll discusses a few reasons why below.
The NASDAQ is already into a bullish MACD crossover. That paired with the break past resistance is enough for us to make a bullish call here. But if that weren't enough, we could also look at volume and come to the same conclusion. The volume behind the buying has been the strongest we've seen in weeks. And more than that, it's been consistently strong.
True, it probably is institutional buying, as they reposition this time of year. But if stocks are going higher, they're going higher - regardless of the reason.
The only potential pitfall we see is the degree of gains over the last three days of the week. The index really pulled away from its moving averages lines - far enough away to perhaps get reeled in a bit. That's ok though, as the bullish have already struck a good blow. As long as the 1- day (red) or 20 day (blue) moving averages hold up as support during a pullback, this new uptrend should remain alive.
On a side note, the current scenario is bullish also because we're now seeing the NASDAQ start to lead in terms of percentage gains. It had been lagging - badly. But now with investors seeking aggressive names like the ones that make up the composite, the subtly hint is that the market is thinking bullishly.
NASDAQ Chart - Daily

S&P 500 Commentary
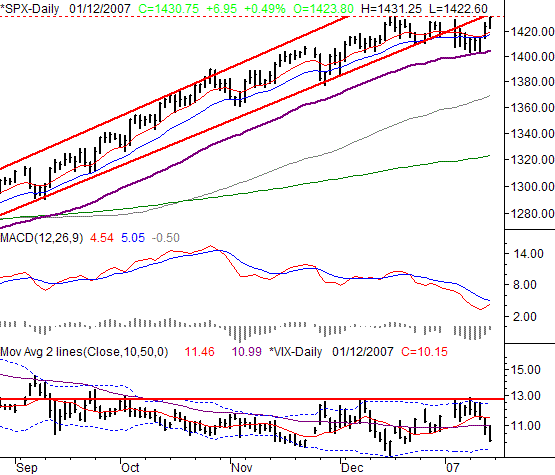
The S&P 500's 6.95 point (+0.49%) meant a close of 1430.75 on Friday. For the week, the index closed 21.05 points higher, or 1.49%. That was an impressive move, but the S&P 500 has one more hurdle to cross - one the other indices don't - before we can say we see fully confirmed bullishness. But make no mistake, based on last week's chart, we think the market is indeed setting up another bullish leg.
That final barrier is 1432 (red, dashed). That's essentially where we toped out in mid-December, close to the peak on January 3, and basically mirrors Friday's high, Yes, we know we're splitting hairs here, but that's the discipline.
In the meantime, and as we discussed last time, the 50 day line ended up serving as support, and then acting as a launchpad for this rebound. That led to a cross back above the 10 and 20 day averages, which is a short-term buy signal in itself.
The VIX also chimed in, signaling this pop was likely when it encountered resistance around 12.70 (thick, red). That was where the VIX hit tops in December, and then again in early January. It was also where the VIX's upper Bollinger band (blue, dashed) was at the time, which made it even tougher for the VIX to move higher.
As for when the VIX might encounter support, it's not happened yet. The lower band is at 9.6, and we doubt it will be able to turn up again until such a floor is hit (see mid-December for an example). During the time it will take for the VIX to get that low, which could be in just one day, the SPX should have enough of an opportunity to break past 1432.
S&P 500 Chart - Daily

Dow Jones Industrial Average Commentary
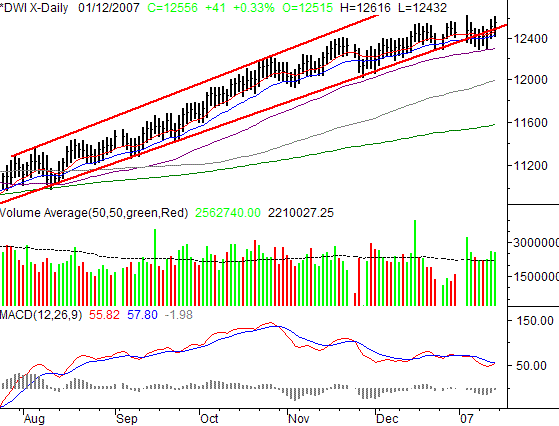
The Dow Jones Industrial Average (found another 41 points on Friday, gaingin0.33% to tend the session at 12,556. That was 158 points (1.27%) above the prior week's close, and definitely puts this chart back into a bullish zone of sorts.
Not much to add here, as the story seems about the same. The 50 day line served as a springboard, pushing the DJIA back into its long-term bullish zone. The 10 and 20 day line are again acting as support. And, you don't need us to tell you the Dow has been hitting new all-time highs of late. (While we're always skeptical to follow the conventional wisdom 'buy new highs', in the case of the Dow it would have paid off.)
That being said, most pundits are arguing that large cap stocks are primed to lead in 2007. We don't disagree. We just want to note that this does indeed include all of the Dow names. Didn't we just say the NASDAQ (more aggressive. Smaller) stocks were taking the lead? Yeah. A contradicting view? Yes, somewhat. The bullish-about-large-cap view is a philosophical one, and has more to do with rotation and the economic cycle. The NASDAQ-leads view is a technical one, and shorter-term. The question you need to ask if you want to act on either theme is simply what your timeframe and desired activity level is. Are you an investor, or trader, or both?
By the way, the market is closed on Monday in observance of Martin Luther King Jr. Day. Trading will resume on Tuesday.
Also keep in mind that this coming week is an expiration week. The last few have been wild and unpredictable, and we doubt this one will be any different. Conventional thinking - even our technical analysis - can get trumped.
Dow Jones Industrial Average Chart

Price Headley is the founder and chief analyst of BigTrends.com.