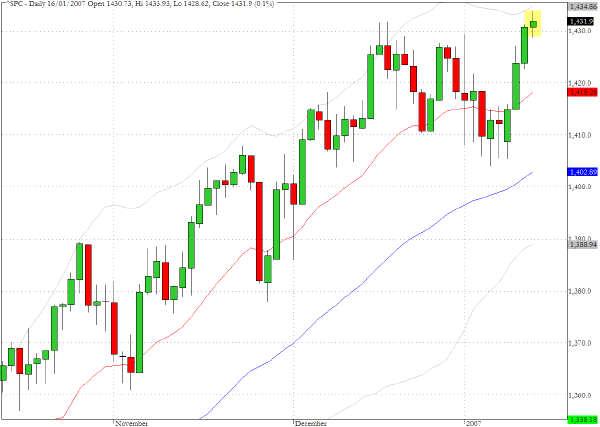
Tuesday's action was somewhat erratic and concluded with a mixed performance amongst the major indices. The S&P 500 (^SPC) managed to register a tiny gain on the session and thus achieved a new multi-year high, while the Russell 2000 (^RUT) dropped by 0.4% and created a long upper shadow (see below) and the Nasdaq Composite registered a small loss as it left a red spinning top candlestick. As the daily chart for the S&P 500 shows a narrow range spinning top candlestick was registered and in scanning the individual charts several stocks recorded their narrowest range of trading in seven (NR7 patterns).
The Russell 2000 (^RUT) registered a rather pronounced shooting star candlestick formation yesterday as it ran into selling resistance just below the 800 level. The most recent all time high was attained on December 5th and the index turned back yesterday just below the intraday high that was achieved in that early December session.
The retail sector continues to show relative strength as it pushes to new highs. The ETF for the sector RTH reveals that the recent price strength however is being registered on subdued volume.


TRADE OPPORTUNITIES/SETUPS FOR WEDNESDAY JANUARY 17, 2007
The patterns identified below should be considered as indicative of eventual price direction in forthcoming trading sessions.
The chart for Cytyc (CYTC) reveals negative momentum and money flow divergences.

US Global Investors (GROW) appears to be struggling in a flag/pennant formation following a bout of selling at the turn of the year.

We have benefited from our long recommendation for News Corporation (NWS) back in December but the most recent price action suggests that a short term top may be near at hand.

Clive Corcoran is the publisher of TradeWithForm.com, which provides daily analysis and commentary on the US stock market. He specializes in market neutral investing and and is currently working on a book about the benefits of trading with long/short strategies, which is scheduled for publication later this year.
Disclaimer
The purpose of this article is to offer you the chance to review the trading methodology, risk reduction strategies and portfolio construction techniques described at tradewithform.com. There is no guarantee that the trading strategies advocated will be profitable. Moreover, there is a risk that following these strategies will lead to loss of capital. Past results are no guarante of future results. Trading stocks and CFD's can yield large rewards, but also has large potential risks. Trading with leverage can be especially risky. You should be fully aware of the risks of trading in the capital markets. You are strongly advised not to trade with capital.