NASDAQ Commentary
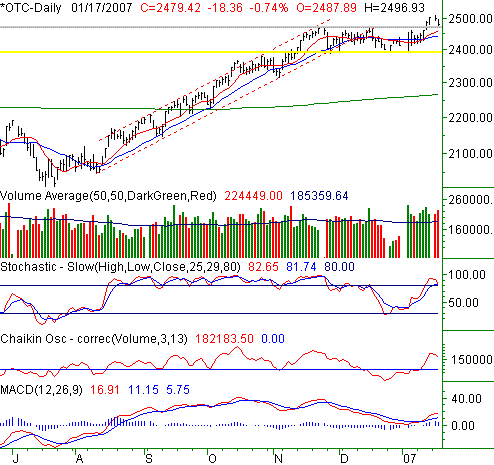
The NASDAQ Composite underperformed badly for the second day in a row on Wednesday, losing 0.74% (-18.36 points) to end the day at 2479.42. That loss followed Tuesday's selloff of 0.20% (5.04 points), leaving the composite in the hole by 0.93% (-23.40 points) for the week. This doesn't exactly appear bullish for the NASDAQ, nor for the market, since this index typically leads both up and down trends.
You'll recall from our last mid-Week update that the line in the sand was the resistance at 2470. Well, that was blown past late last week when the index rallied all the way up to Friday's close of 2502.82. It was a new multi-year high that was met the next time the exchanges re-opened with some substantial profit-taking, and some high volume selling.
Based strictly on the direction of the last two days, we're actually looking for more downside momentum over the rest of this week. However (and this will have more meaning as you read the rest of our outlook below), that doesn't necessarily mean the NASDAQ is likely to slip into a new bear trend. It just means (so far) that the index got a little heated up too quickly.
So, while the composite could fall a little more before a floor is found, we actually can't get worried unless the NASDAQ gets all the way back under 2400 (yellow), where it bottomed several times over the last three months.
On the flipside, we're not going to be able to think like bulls again until one of two things happens. The first is support at the 10- or 20-day line around 2450, with a rebound kicking in. The second is a couple of closes above the recent high of 2508.93.
NASDAQ Chart

S&P 500 Commentary
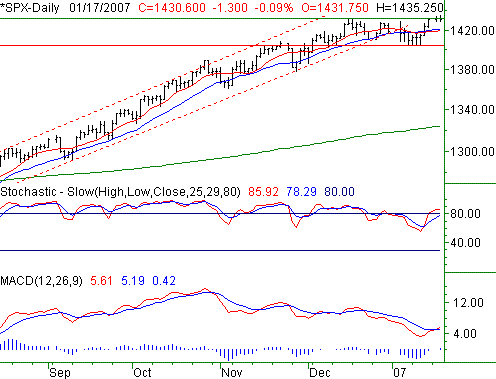
The S&P 500 managed to come out of Wednesday mostly unscathed, losing 1.3 points (-0.09%) to end the session at 1430.60. That's only 0.15 points (-0.01%) under last week's close -- close enough for us to call even. And even though we saw new 52-week highs for a brief moment on Wednesday, the inability to hold onto them should concern the bulls.
You might recall we were working off of a resistance line around 1432 at the end of last week. Tuesday's strong start made it appear as if the buyers were going to keep at it in the last half of the month like they did in the first half. However, we peaked at 1433.95 that day, and then closed at 1431.90 -- suspiciously right at that resistance level. On Wednesday we marched even higher, getting to 1435.25 before pulling all the way back to 1430.60.
That late-Wednesday action is the worry. Technically speaking, it was a bearish outside reversal bar, and doesn't exactly scream "buy new highs."
As for what the bulls have going for them, even an unimpressive move into new high territory is still ground-breaking, and don't forget about the new MACD crossover made just yesterday. The problem with the former is, it was a struggle to break past 1432, and so far it's been impossible to stay there. The problem with the latter? Bullish MACD crossovers have become academic of late. We've seen four since November, and none of them really meant anything. (In all fairness though, we've been stochastically overbought for months, but none of the stochastic sell signals since September have been accurate either.)
So, with the technical analysis indicators being rendered a little useless for the time being, we're going back to the basics -- the chart. A couple of cleanly decisive closes above 1432 will be bullish. A slide all the way back under 1405 where we bottomed in early January will be bearish. Anything in between that horizontal range really may not mean much, though it could set up a couple of decent scalp trades if you're just playing bounces within that narrow band.
On a side note, we're now 8.0% above the 200-day moving average line (green). This is a very unusual occurrence, and increases the likelihood that weakness could set in. For the sake of argument, the index was that far above (or further) its 200-day line during most of the late 90's. But, more often than not, such a strong move has been met with a comparably strong pullback to the long-term average. A slide back to 1323 may seem impossible at this point. However, it would only be about a 7.5% dip, which is in line with the typical market correction. We'll discuss that possibility in more detail if it looks a little more imminent later.
S&P 500 Chart

Dow Jones Industrials Commentary
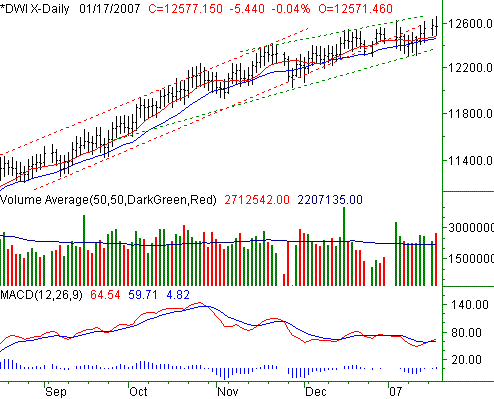
The Dow Jones Industrial Average ended Wednesday at 12,577.15, a mere 5.44 points below (-0.04%) Tuesday's close. For the week, the blue chip index is still just barely in the plus column. We're just 21.07 points (+0.17%) above last week's closing level. While the short-term moving averages (10 day, 20 day) are still providing support more often than not, we also still see a gradual slowing of last year's strong rally. Yes, the Dow hit yet another new high of 12,666.71 on Wednesday, but those new highs are becoming harder and harder to achieve.
You'll see plenty of markings on this week's Dow chart and here's the deal. The red dashed lines are the previous bullish channel, which was officially and decisively broken in mid-December. The green dashed lines are the new channel, which is still bullish, but not as bullish. All downside reversals start out just looking like lulls, which is why our concern is growing.
On the other hand, being sticklers for details, we have to remain cautiously bullish here for a couple of specific reasons. First, the 10- and 20-day moving averages (red and blue, respectively) are again supporting the index. Second, while only modestly bullish, the new channel framed in green is indeed still rising. The confirming clue is the bullish MACD crossover seen Tuesday. Of course, it's a bit tainted, being the fourth one in a little over three months.
Support is at 12,490 and 12,467, where the short term averages are possibly going to hold the index up. The bigger-picture support is still the bottom edge of the rising channel, currently at 12,365. If that level breaks, we're looking for bigger problems.
Dow Jones Industrials Chart

Price Headley is the founder and chief analyst of BigTrends.com.