NASDAQ Commentary
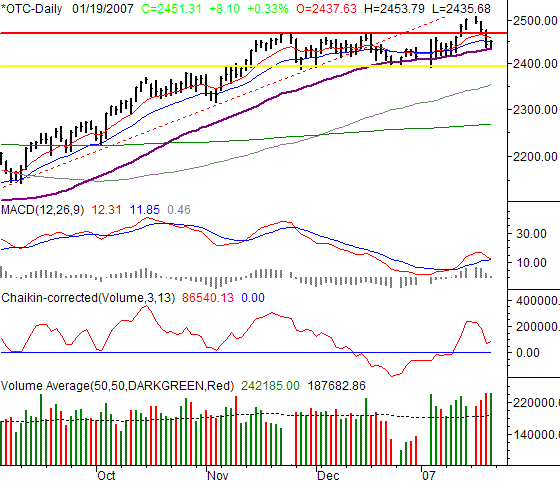
The NASDAQ Composite's gain of 8.10 points on Friday (+0.33%) left the index at 2451.31 for the week. That was 51.51 points lower (-2.06%) lower than the previous week's close, and leaves the composite right on the verge of a breakdown again.
What a week! A complete reversal of the previous week's big rally. However, between the two weeks, the trend is essentially a wash. And, the index is trapped between support and resistance.
The resistance is the 20-day moving average line (blue) at 2451. We fell under it sharply on Thursday, and the rebound on Friday got stopped right there.
The support is the 50-day average (purple) at 2434. The selloff got halted there on Thursday, and that's where the recovery move was staged on Friday. It's a big deal in itself, made even bigger by the fact that the 50-day line was where the bulls drew the line at the end of last year/beginning of this year. If the bears really want to get a grip, we need to see a couple of closes under the 50-day line before we can see the market is truly headed lower. (It would be the first time we made two consecutive closes under the 50-day moving average line since last August.) If you're looking for an even safer bearish confirmation, wait for a close under 2394 (yellow), where we've seen support since November.
On the flipside, a close back above 2470 (red) - where we topped a couple of times late last year - would be bullish. We popped above there a couple of weeks ago, but clearly had no staying power.
Note that most of the technical indicators are painting an indecisive picture.
NASDAQ Chart - Daily

S&P 500 Commentary
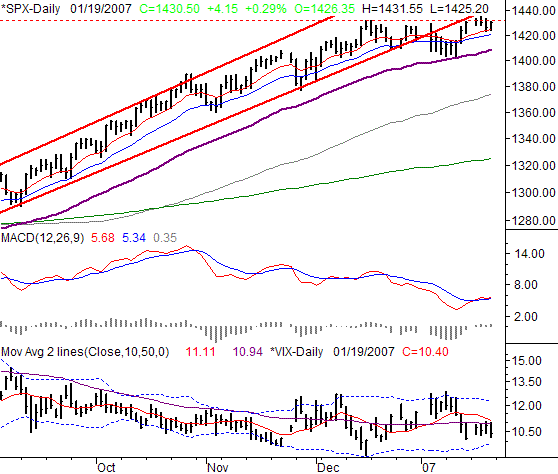
On Friday, the S&P 500 ended the session 4.15 points higher, gaining 0.29%. On a weekly basis, that was 0.25 points, or 0.02%, lower for the shortened option expiration week.
Bullish overall? Yes, still, but that's certainly in question. The fact is, the 10-day line (red) held up as support at the end of last week, and we hot a new 52-week high the day before that. However, this is definitely not the kind of strength we were seeing just a few weeks ago.
But, as we said of the NASDAQ, and as we'll say about the Dow, the picture is about as mixed as can be right now.
We're about where we were as of mid-December. And, it's becoming much easier to pull back than it is to advance. That faltering is bearish.
Yet, it can't be denied that we are still inching higher -- support at the 10-day line, a bullish MACD divergence, hitting new highs. As with most of the indices right now, there are pretty clear support and resistance lines. The key support line we're watching is the 50-day average (purple) at 1408. The resistance line is still at 1431. True, we peaked above there briefly last week, but have yet to close above there. If we do though, the bulls will have a much stronger case.
We'd look closely at the VIX, but immediately following an expiration week, it may not be fruitful. Right now it's low, and also approaching a potential support area (the lower Bollinger band). Yet, we've seen the VIX hit the lower band line before, and just keep tracing it lower (see late November). The possible difference this time is the major increase in volatility since late November. Just look at how the VIX has been bouncing around since November - a stark difference in the VIX's minimal swings for the four months before that. In other words, support and a bounce is more likely at the lower band line right now. If that's what happens, we'll look for stocks to make good on their downside potential, as long as the SPX's 50-day line breaks.
S&P 500 Chart - Daily

Dow Jones Industrial Average Commentary
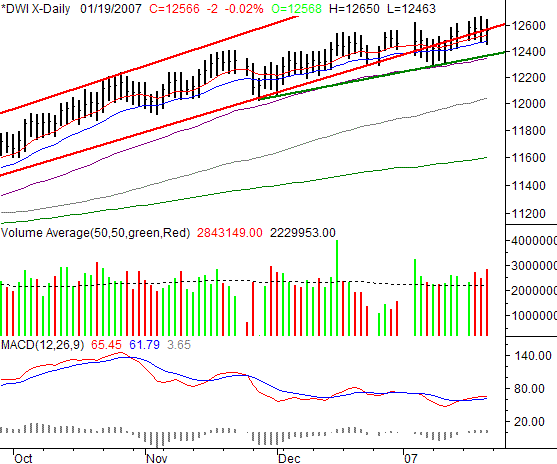
The Dow Jones Industrial Average saw a miniscule loss of 2 points on Friday, but an equally imperceptible gain of 10 points for the week. That was a loss of 0.02% for the day, and an 0.08% gain the from the prior Friday's closing level. To see the blue-chip index hold its ground is bullish in a sense, thanks to the support sustained at the 10- and 20-day moving averages. However, the bullish envelope is certainly being pushed.
As the chart shows, that longer-term bullish channel is still technically breached, as the pace of gains has slowed off quite a bit. However, we'd be hard pressed to say this was a big problem just yet. It's not impressive for the bulls, but it's not a problem.
The red flag is all that selling volume the last three days of the four day week. That was the biggest distribution wave we've seen since late October. That, paired with an already-struggling chart, doesn't bode well for the bulls.
So, here's how we're playing it - consider this a notice for the Dow. Our line in the sand is the 50-day line (purple) at 12,348. We found support pretty close to that before the runup two weeks ago. Most other support has given way; that's going to be the last likely floor. Plus, there's a new support line (green) being formed there.
In the meantime, don't get too excited about a renewed uptrend unless we start to see new all-time highs again. That would be a move above 12,667.
Dow Jones Industrial Average Chart

Price Headley is the founder and chief analyst of BigTrends.com.