After a prior column, I received a lot of great feedback. As always, thanks for your support. The topic also prompted a lot of questions. The bottom line was simple - you guys wanted to know exactly how to go about setting a target. Unfortunately, there's no easy answer to that question, nor is there just one answer. In fact, we'll probably need a couple of columns to fully cover the topic. So with that, let's just look at a couple of the philosophies that will help you decide your targets.
1. Look for the historical patterns on a chart.
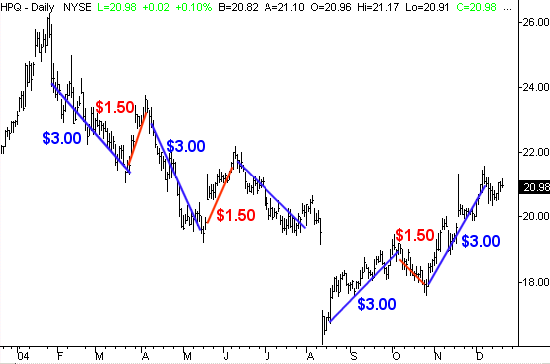
Not every stock does it all that clearly, but nearly all stocks do it on some fashion. The idea is simple - history repeats itself. Review several months worth of charts for a particular stock, and you'll find that the zig-zag of gains and losses occurs over and over in surprisingly consistent dollar amounts. This is especially true for a "range-trading" stock (but not unusual for a long-term trending stock). Let's look at an example using Hewlett-Packard (HPQ). Going all the way back to the beginning of 2004, we've seen HPQ shares move for two months in one direction, then reverse the other direction for about two weeks. The two-month move was about $3 worth of price change, while the two-week reversal was about $1.50 worth of price change. The really interesting part was that this time and size pattern held true in either direction. On the chart below, you can see it's not perfect, but it would have given you a pretty good idea of what kind of move to expect.
Hewlett-Packard (HPQ) - Daily

There's a caveat - patterns can be broken. And there's also a warning - don't assume every stock moves in consistent patterns, because some just don't. But if you're trying to determine a realistic target, using the historical movement is a great place to start.
2. Use previous highs or lows and support or resistance as potential reversal points.
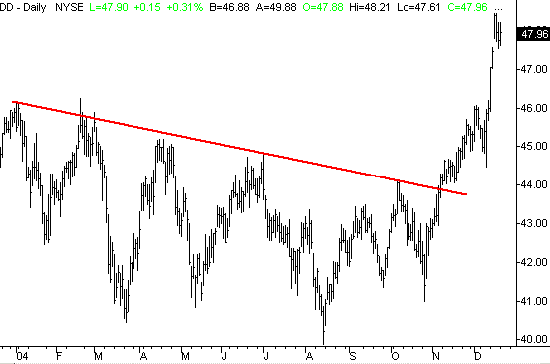
Quite frankly, this isn't news to many (if any) of us, but it's much easier said than done. There's a reason that a stock's movement was halted at a particular price point. The more recently that reversal occurred, the more likely it is that the reason still exists. And if you see the same high or low more than two or three times, you can bet that more and more traders are drawing those same lines on their charts. This creates a self-fulfilling prophecy of a sort, but that doesn't make it any less probable. I'm still surprised by the number of traders that make this concept harder than it is, but for those who have gotten over the mental hurdle of thinking "this time is different", using these very simple lines has gotten them in and out at the optimal times. A recent DuPont (DD) chart illustrates this idea. Basically, DuPont hit the same resistance line (red) five times. Granted, you really wouldn't have known this line was a resistance line until after the second time a reversal occurred, but that would have still left you three occurrences of reversals. In short, if you're a swing trader, set your target at established resistance and support.
DuPont (DD) - Daily

There's a footnote here too. Yes, DD shares blew right threw that resistance line in November. The pattern failed at that time, and instead of exiting long trades or shorting at that line, you should be buying that breakout. Rather than dwell on the past, just move on and accept what the market is doing. Remember the twelve trading affirmations from December 8th ? The twelfth one was "I act upon what the market is doing, rather than what I think it should be doing". This DuPont chart is an example of why a trader needs that kind of mental discipline. You would have gotten at least three good short entries or long exits when DD hit that resistance, and if you played the bullish breakout right, you'd have gotten a very good long entry. You just have to draw these lines on your charts and execute the patterns as they appear. I know this isn't ground-breaking, but hopefully this will help you re-enforce the idea.
OK, that's enough for today. Like we said, it could take several columns to get through all the "target setting" talk, but we're excited about doing it, since it's such an important piece of the trading puzzle.
Price Headley is the founder and chief analyst of BigTrends.com.