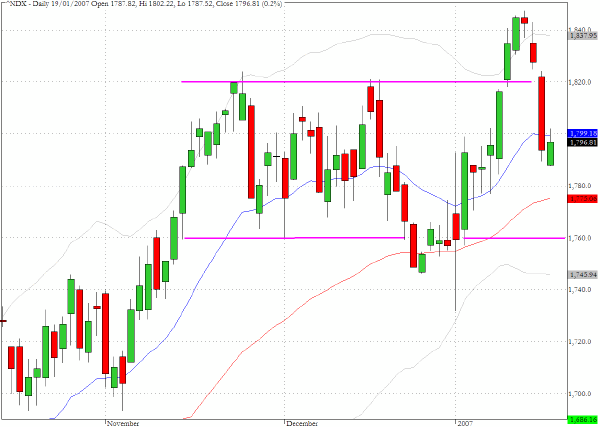
The Nasdaq 100 (^NDX) managed a small gain on Friday that brought the close back to almost exactly the level of the 20-day EMA. We have marked the channel between 1760 and 1820 that has largely confined trading for more than two months. During the period there have been two false breaks out of the channel - the apparent breakdown below the lower bound and violation of the uptrend in late December and the most recent breakaway that suggested that the index was ready to mount another leg up that began just over a week ago.
Friday's close was close to the middle of the channel, and underlines the fact that despite a lot of back and forth, there has been a lot of churning and very little progress has really been made by the index since early November.
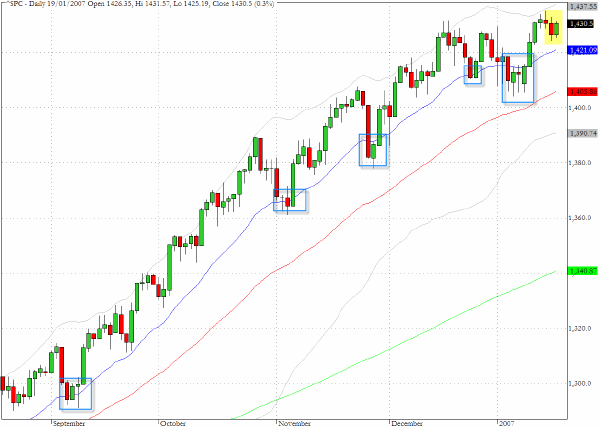
The Nasdaq 100 chart that we just examined essentially shows a sideways pattern to the index's price development since mid November when the powerful momentum that produced the fall rally began to fade. Reviewing the daily chart for the S&P 500 (^SPC) since September we see echoes of the pronounced upward trend that characterized the price action in this index as well as the Nasdaq but the S&P 500 experienced a continuation of momentum that persisted until the end of 2006.
On each occasion when the benchmark index came into contact with the 20-day EMA a swift recovery ensued suggesting that all such dips were construed as a buying opportunity for index traders and asset managers. The corrective action in early January presented the first real questioning of whether the uptrend is about to be replaced by a consolidation plateau. Our instincts tell us that global liquidity conditions favor a retest of the historic S&P 500 high which lies about 100 points above Friday's close, but there are some early indications that a distributive top could be developing.
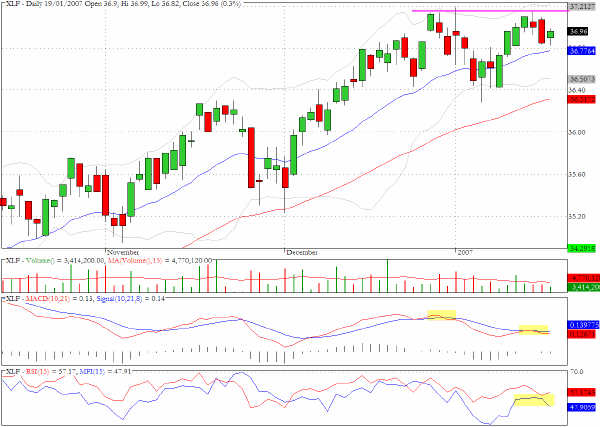
XLF, the exchange traded fund for the financial sector may have reached an interim plateau.
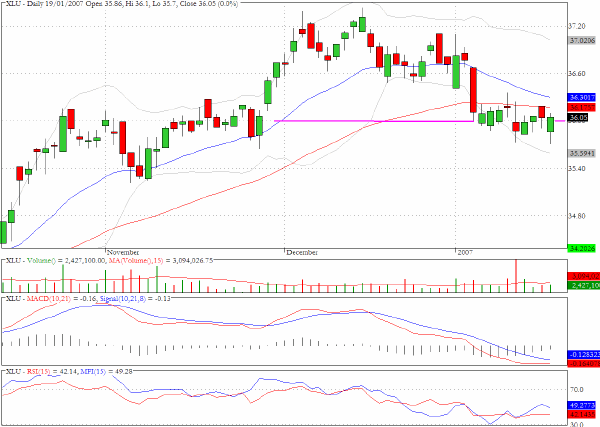
The utilities sector fund, XLU, has been straddling an important level of chart support for the last two weeks. As with our previous comments above, the expectation is that an extended sideways/consolidation pattern may be the most likely scenario in the intermediate term.
TRADE OPPORTUNITIES/SETUPS FOR MONDAY JANUARY 22, 2007
The patterns identified below should be considered as indicative of eventual price direction in forthcoming trading sessions. None of these setups should be seen as specifically opportune for the current trading session.
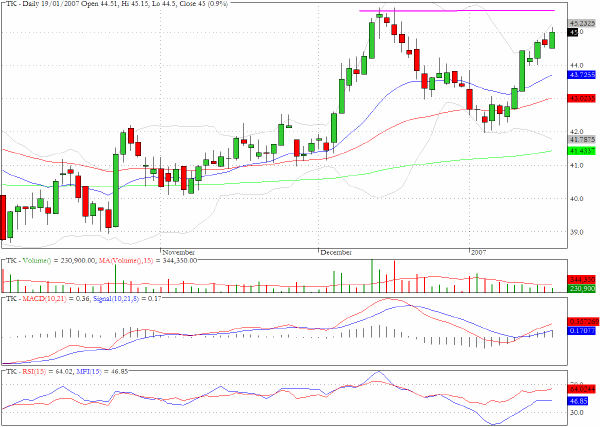
Teekay Shipping (TK) could be approaching a possible double top formation as the momentum and money flow have faded since the price last reached above $45 in mid December.
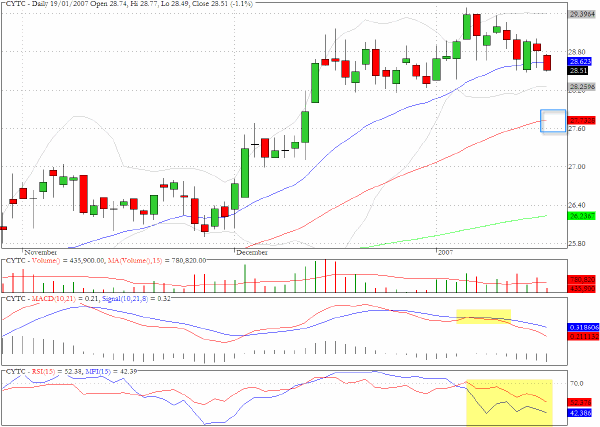
We pointed out in last Wednesday's commentary that the chart for Cytyc (CYTC) was revealing negative momentum and money flow divergences and there still seems further potential downside.
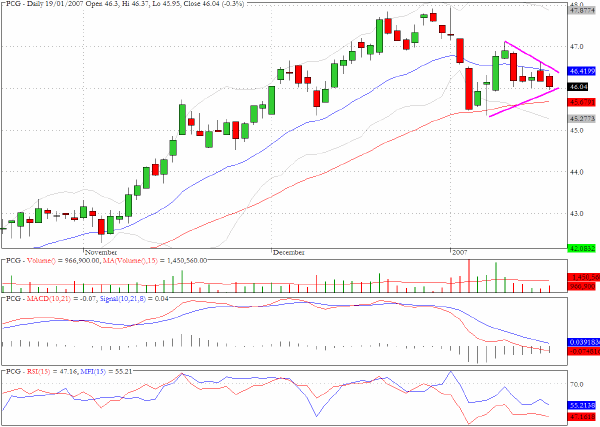
PG & E Corporation (PCG) is one of the constituents of the utility sector fund XLU that we reviewed above. The triangular formation suggests that a directional expansion may be imminent.
The manner in which this pattern, and similar ones for other individual utility stocks, is resolved will provide early insight into the validity of our expectation of a sideways trend for the overall sector.
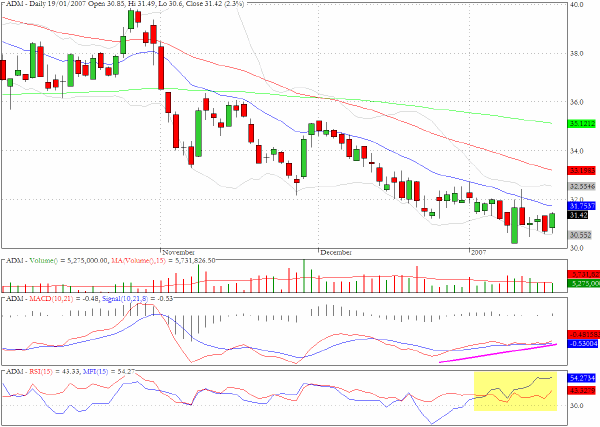
Archer Daniels Midland (ADM) appears to be ready to mount at least a short term rally from the steadily downward trajectory that has prevailed since early December.
Clive Corcoran is the publisher of TradeWithForm.com, which provides daily analysis and commentary on the US stock market. He specializes in market neutral investing and and is currently working on a book about the benefits of trading with long/short strategies, which is scheduled for publication later this year.
Disclaimer
The purpose of this article is to offer you the chance to review the trading methodology, risk reduction strategies and portfolio construction techniques described at tradewithform.com. There is no guarantee that the trading strategies advocated will be profitable. Moreover, there is a risk that following these strategies will lead to loss of capital. Past results are no guarante of future results. Trading stocks and CFD's can yield large rewards, but also has large potential risks. Trading with leverage can be especially risky. You should be fully aware of the risks of trading in the capital markets. You are strongly advised not to trade with capital.