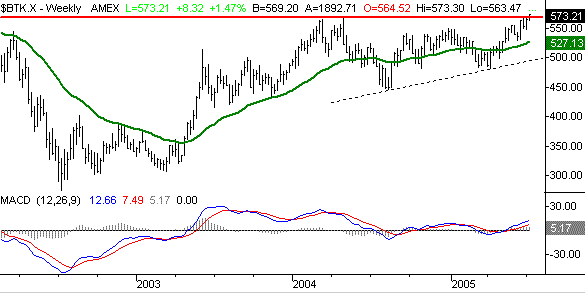
The last few weeks have shaken the market up pretty well. While that type of back-and-forth movement can be frustrating, it's actually the time when it's easiest to spot the leaders and laggards. This time around, the biotechs emerged as one of the more newly bullish sectors. There's no doubt that this sector will remain as volatile as it always is, but the upside pressure on these charts is setting up a big bullish move.
The index in question is the Amex Biotechnology Index (BTK). However, you'll find similar charts of the Dow Jones Biotech Index (DJUSBT) and the NASDAQ Biotech Index (NBI) . The Amex Index moved to new 52-week highs three weeks ago by hitting 569. These stocks pulled back slightly the following week along with the rest of the market, but never gave up as much ground. Then the index fully recovered last week, only to move on to a new 52-week high of 572 on Tuesday. Just for the record, the biotech stocks are the sixth strongest performing index over the last three months, and have enough momentum to improve that standing. That sheer strength is what we like, as industries that hit new yearly highs typically continue to do so for weeks (if not months) on end.
The weekly chart illustrates another important chart aspect.....support, and a break through resistance. The previous recent high of 568 was hit in early 2004. After reaching that point, the market - and this index - turned around and fell to a low of 446 by August of 2004. The next move higher didn't bring the Amex Biotechnology Index back up to that previous high, so the bigger trend was in question at that point in time. These stocks pulled back again early in 2005, but only fell to 481. That low has wound up serving as the bounce point for the breakout move - we now have a higher high following a higher lower. Additionally, we have a bullish MACD crossover
Amex Biotechnology Index (BTK) - Weekly

It may seem a bit surprising that the speculative biotechs can be so strong when it looks like the market in general is poised for a tumble. But that's the reason we look at charts - to find trends that defy the odds. This chart just looks bullish, regardless of what other stocks are doing. We'll set a target of 640 for the Amex Biotechnology Index (BTK). The stops on this bullish bias come with a close under the 50 day line (not shown), currently at 542. We want to leave this group plenty of room for volatility.
In some cases, it can make sense to find a stock within a sector to trade, rather than trading an index directly. In this case, though, that could be difficult, and not worth the risk. The biotechs are still speculative and inconsistent, and most of the individual stocks can and do turn on a dime. The sector trend itself is much more likely to provide some consistency.
Price Headley is the founder and chief analyst of BigTrends.com.