NASDAQ COMMENTARY
The market tone looked like it might improve greatly this week, after a pretty dismal end to trading last week was met with a big rally on Tuesday. And for a brief time today, it looked like the NASDAQ was poised to tack on another bullish session. But once again, the rally attempt faded quickly, and the composite sank back into the red. By 2:30 pm EST, the bulls were sent scrambling as the sellers took control again, aided by renewed worries of inflated oil prices.
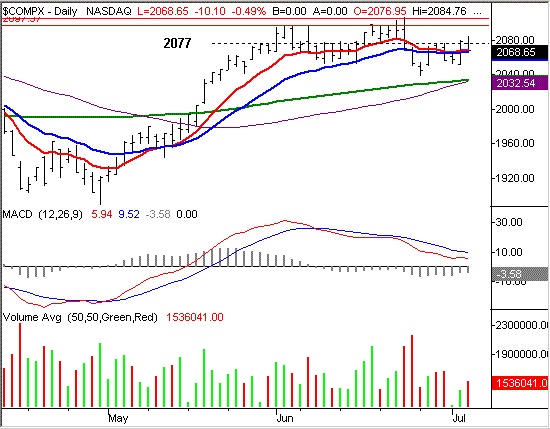
By the end of the trading day, the composite had pulled back to 2068. That close is basically founded on the support at the 10 and 20 day lines, as you'll see on the chart. So while we closed in the red after a big intra-day reversal, we have to respect the fact that the bulls are hanging in there. On the other hand, we have to say that we don't expect the support at 2066 to last much longer (if any longer at all). As far as the price bars are concerned, today leaves us in a neutral position. But that's not all that we're seeing. The MACD lines gave us a bearish cross almost a month ago, and that signal hasn't changed. The market has been up and down since then, but the sell signal has held steady. In fact, the MACD lines are showing a new bearish momentum divergence today, so....it is what it is.
Bullish volume is still on the weak side, so the number of buyers needed to sustain any rally may not be willing to take action just yet. The sellers, however, aren't hard to find. Today's selling volume was greater than yesterday's bullish volume, qualifying it as a distribution day......the fifth over the last twelve sessions. The growing selling volume coupled with the bigger picture downward momentum is why we're still siding with the bears here, despite a rather stagnant NASDAQ.
That said......
We'll mark support at 2067, where the 20 day line currently lies. Support is also at 2033. That's where the 50 day line and the 200 day line are converged. As for resistance, 2100/2105 is still the line in the sand. So while we're generally bearish, that ultimately hinges on breaking under 2033. Until one of those boundaries is broken, the NASDAQ will be stuck in this rut. Once (or if) 2033 is breached, our target for the NASDAQ is this year's low of 1890.
NASDAQ CHART

DOW JONES INDUSTRIAL AVERAGE COMMENTARY
We're sticking with the Dow's chart today to contrast the difference between this blue-chip index and the more speculative nature of the NASDAQ.
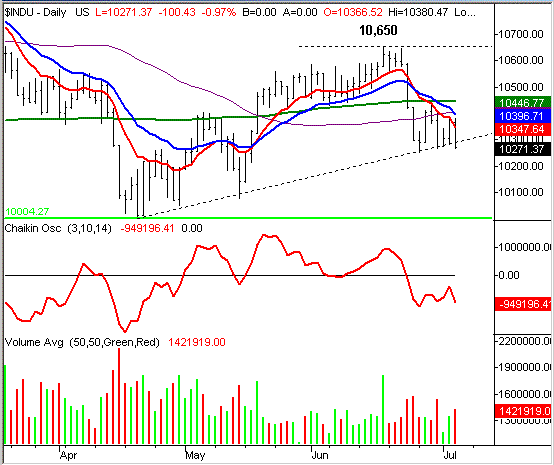
While the NASDAQ is flashing glimmers of hope, the Dow Jones Average is offering none. Why? A ton of resistance. The primary resistance is at the 10 day line, or 10,373. That's about where we topped out today, as well as yesterday (and the middle of last week for that matter). To salt the wound, the Dow is now well under all of its key moving averages. Want more? OK, the 10, 20, and 50 day lines are also all under the 200 day average. That's a confirming signal of just how this short-term trend is getting a little long in the tooth. These moving average crossunders are no small matter, but the clincher is the failure of the last possible support line. That support was at 10,290 today, marked with the dashed line extending all the way back to the lows from April. The Dow average has been pressing into this support pretty firmly for the last four sessions. We normally allow a little wiggle room, but this is getting to be more than 'a little'. The point is, as time marches on, more and more sell signals are being checked off.
And the number of sellers here? Don't worry - there are plenty. The Dow turned for the worse on June 20th, and 9 of the last 12 trading days have led to losses. The bearish volume was basically growing throughout that move. The positive moves on Friday and Tuesday, well, that bullish volume was a little anemic. Today's volume was higher than Tuesday's making this a technical 'distribution' day.
Between the growing number of sellers and the sustained bearish momentum, we expect the Dow to sink before bouncing. And now that the support at 10,290 has given way, that seems even more likely. The next nearest support area is this year's low around 10,000, so we'll set our target there.
The Dow closed at 10,271.
DOW JONES INDUSTRIAL AVERAGE CHART - DAILY

Price Headley is the founder and chief analyst of BigTrends.com.