| Is the VIX Still a Useful Indicator? |
| By Price Headley |
Published
01/25/2007
|
Futures , Stocks
|
Unrated
|
|
|
|
Is the VIX Still a Useful Indicator?
A lot of traders and analysts say the CBOE Volatility Index (VIX) has lost its effectiveness as a sentiment gauge, due to the persistent low levels the VIX has hovered at in recent years. Wednesday the VIX touched under the 10.00 level, a relatively rare occurrence. Does this low VIX mean anything here, or should we throw the VIX on the trash heap of past indicators no longer working?
When you look at the VIX, we've had a remarkable drop from up over 50 back during the bear market to a reading yesterday under 10.00, rivaling the all-time low in the VIX. The VIX has also hovering below the important 20 level since the spring of 2003 for the most part, with one brief fling over 20 last summer near the market lows. Some suggest a VIX near 10 is a sign this indicator of the fear in the options market is no longer valid, but I continue to make money trading the VIX. Here's how:
My experience with the VIX says you have to use an indicator that measures the relative highs and lows. I love bands plotted around a moving average, and for a generally non-trending data series like the VIX, the 20-bar Bollinger Bands with 2 standard deviations (encompassing about 95% of the action within the bands) is particularly effective.
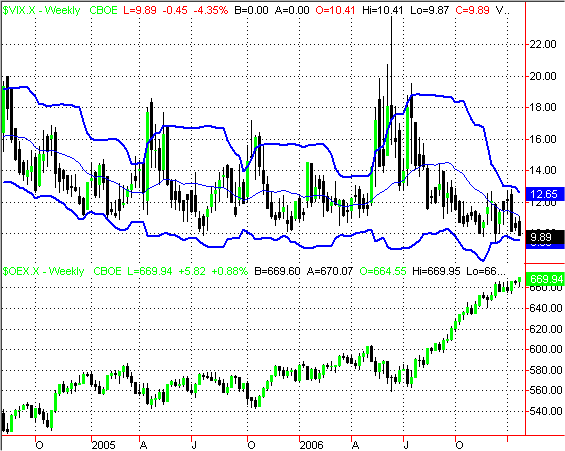
The goal is to track the relative peaks and valleys when the VIX tags the upper or lower band. Let's look first at the longer-term weekly chart of the VIX vs. the S&P 100 (OEX).
Weekly Chart of the CBOE Volatility Index (VIX) vs. the S&P 100

Notice in the weekly chart that when the VIX tags the upper band, that's a sign of relative fear, which occurs as options traders rush for puts, thus bidding up the prices of the options, and in turn bidding up the implied or perceived volatility that traders expect for the market. Bottoms often occur quickly once this fear spike is seen, as in August 2004, April 2005, October 2005 and the May-July period in 2006. In contrast, a tag near the lower bands often signals complacency, as few traders want put insurance (which is usually exactly when you'd like to have this insurance, at relatively cheap low volatility levels for the options price to in turn be relatively low). You can see that currently the VIX is scraping the lower end of its bands, suggesting too much complacency now on this run to new market highs. So this suggests big-picture caution, though the VIX is a leading indicator and such can be 1-3 weeks early.
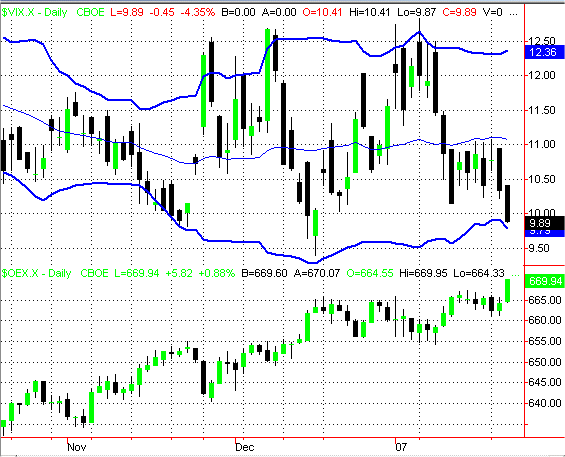
Let's also look at the daily chart for a more fine-tuned view:
Daily Chart of the CBOE Volatility Index (VIX) vs. the S&P 100

The daily chart shows something very interesting. While the 10 level or slightly below looks like a place to be careful on the market and lighten bullish exposures, the relative peak in the VIX happened around 12.50 at the start of the year, as well as the classic fear spike in late-November. So forget about where the VIX has been in years past, and instead focus on getting the most of out the VIX using relative bands like Bollinger Bands. You can see that when the market tagged these lower boundaries for the VIX, as in mid-December and mid-November, then the market is ready to correct or at least go sideways. This follow-up information will prove invaluable as a contrarian, being willing to sell the market when the VIX is at its lower band, while being able to get more aggressive when we see fear spikes to the upper band.
So don't rule out the VIX, the put/call ratio or the RYDEX fund flows as useful contrary tools relative to the Bollinger Bands as my favorite bands for choppy data like these sentiment tools.
Price Headley is the founder and chief analyst of BigTrends.com.
|