| Corcoran Technical Trading Patterns for January 26 |
| By Clive Corcoran |
Published
01/26/2007
|
Stocks
|
Unrated
|
|
|
|
Corcoran Technical Trading Patterns for January 26
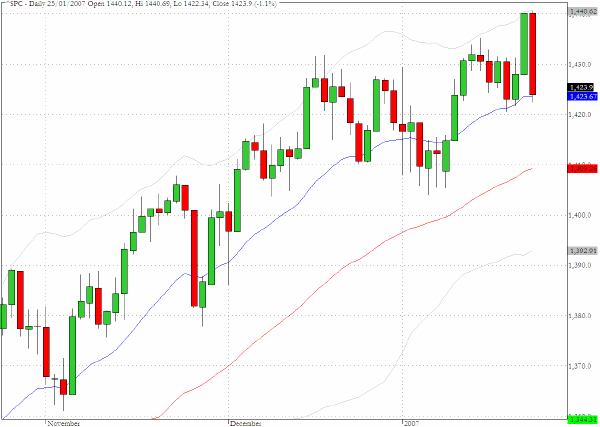
Yesterday was a pretty vicious reversal day for the equity markets. After registering a more than five-year high on Wednesday, the S&P 500 reversed abruptly to close with a 1.1% loss removing all of the previous day's gain and some. In attempting to weigh the significance of the move we took some comfort from the fact that the Russell 2000 (^RUT) performed very much in line with the large cap stocks as it lost 1.2%
As we discuss below, the real lesson from yesterday's whipsaw behavior will become clearer as we track the course of the Treasury market in coming sessions.
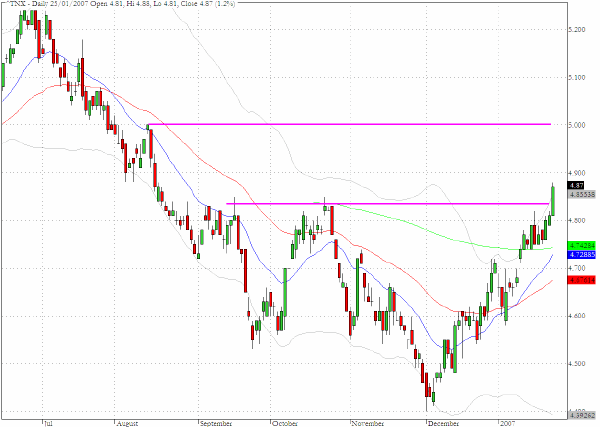
One of the most significant charts from yesterday's trading shows the yield on the ten year Treasury note (^TNX). A difficult Treasury auction raised concerns about the sustainability and reliability of the assumption that foreign investors will continue to have the requisite appetite for US government securities.
If yields continue to climb the five percent barrier should provide some resistance but a revisit to the recent high yields around 5.25% from June 2006 has become more likely following yesterday's action.
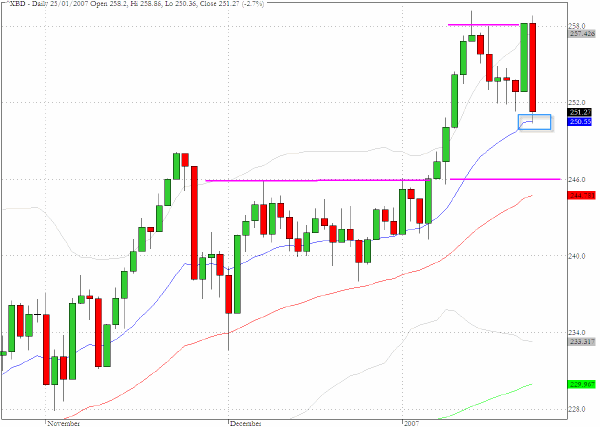
We noted in yesterday’s commentary that the action in the broker/dealer sector index (^XBD) provides a useful barometer to track global liquidity conditions. Yesterday’s strong reversal for the sector underlines this fact as the weakness in the Treasury sector impinges directly on the holdings of the large investment banks and dealers.
Fears about the sustainability of funding the large deficits come to the fore from time to time but usually recede without creating too much fallout. However, there is always the possibility that next time it could be different. A crisis is a correction that doesn’t stop.
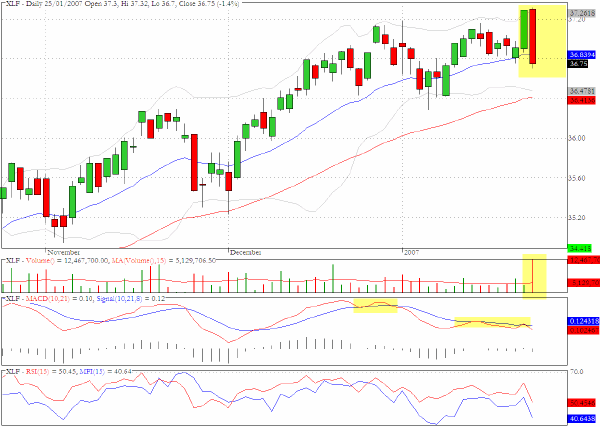
Last week we commented on the fact that the financial sector, as represented by the exchange traded fund, XLF, had signs of negative momentum and money flow divergences. The index kept pushing higher until yesterday and we have included the chart again to illustrate the substantial downdraft on very heavy volume.
A retest of the 50-day EMA looks imminent and we will be watching to see the extent to which sentiment is deteriorating for the sector.
TRADE OPPORTUNITIES/SETUPS FOR FRIDAY JANUARY 26, 2007
The patterns identified below should be considered as indicative of eventual price direction in forthcoming trading sessions. None of these setups should be seen as specifically opportune for the current trading session.
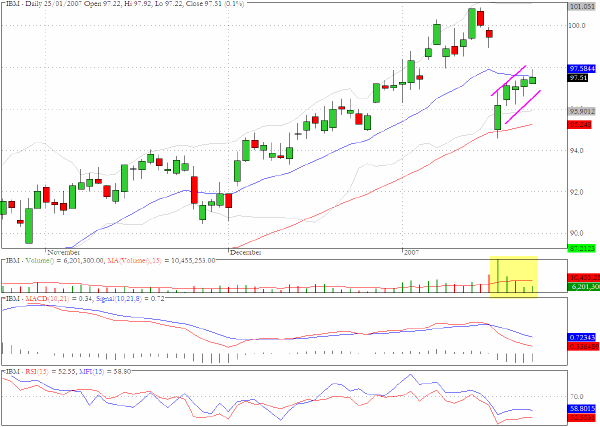
IBM is showing the right characteristics for a bearish flag/pullback channel. As with all instances of this formation, timing the entry point is often a matter of monitoring the 60-minute charts.
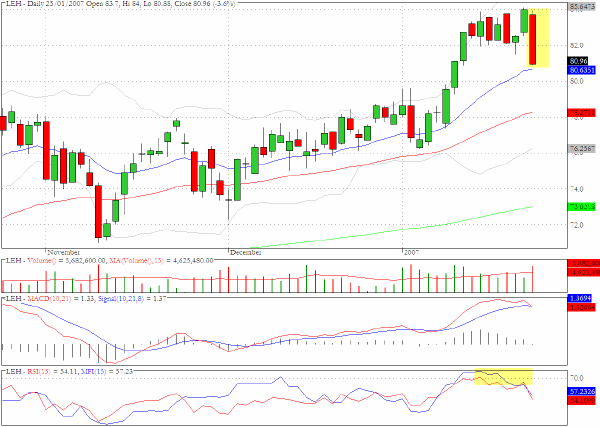
Yesterday we looked at the chart for Goldman Sachs as it was registering an all time high and this was also true for Lehman Brothers (LEH). As we noted in connection with the upward break out in Treasury yields, if the weakness at the auction proves to be more than a one-off event and the breakout was more than a temporary blip up, this will presage more prolonged problems for US will find more serious issues to deal with than an abrupt one day reversal.
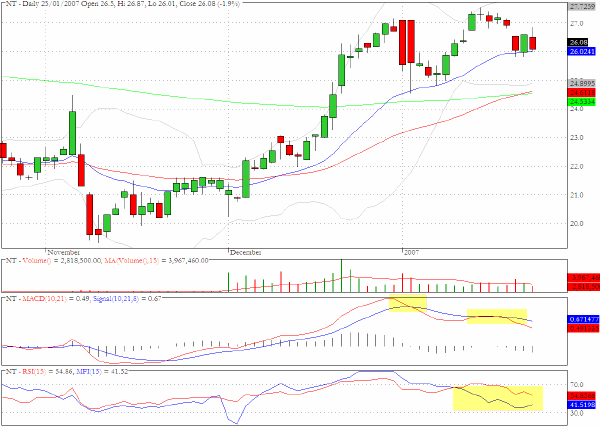
Nortel Networks (NT) could be vulnerable to a retreat towards the intersection of the 50- and 200-day EMA's close to $24.
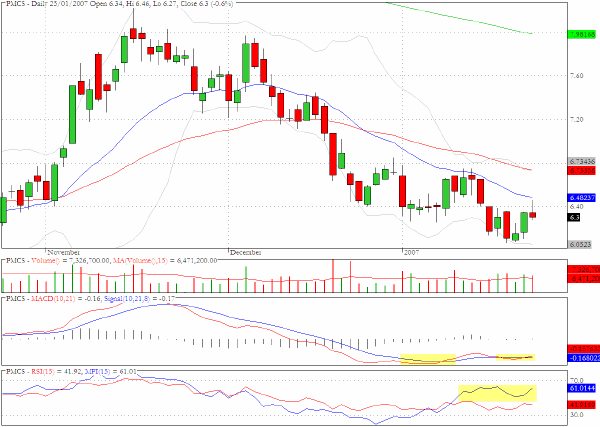
The chart for PMC Sierra (PMCS) is displaying positive divergences on the MACD chart and there is evidence of accumulation. A shot at the 50 day EMA is likely and longer term $7.20 may be targeted.
Clive Corcoran is the publisher of TradeWithForm.com, which provides daily analysis and commentary on the US stock market. He specializes in market neutral investing and and is currently working on a book about the benefits of trading with long/short strategies, which is scheduled for publication later this year.
Disclaimer
The purpose of this article is to offer you the chance to review the trading methodology, risk reduction strategies and portfolio construction techniques described at tradewithform.com. There is no guarantee that the trading strategies advocated will be profitable. Moreover, there is a risk that following these strategies will lead to loss of capital. Past results are no guarante of future results. Trading stocks and CFD's can yield large rewards, but also has large potential risks. Trading with leverage can be especially risky. You should be fully aware of the risks of trading in the capital markets. You are strongly advised not to trade with capital.
|