| What Are Consolidation Breakouts? |
| By Andy Swan |
Published
01/26/2007
|
Currency , Futures , Options , Stocks
|
Unrated
|
|
|
|
What Are Consolidation Breakouts?
A Consolidation Breakout is a technical formation that indicates bullish or bearish price action. There are a few things you must look for when establishing whether or not you can place a trade based on a consolidation breakout.
- The stock must be trending sideways (consolidating).
- The stock must break out of the consolidation pattern with higher than average volume confirming the breakout move. A break above consolidation resistance on higher than average volume is a "bullish breakout." A break below consolidation support on higher than average volume is a "bearish breakout."
- You may enter your position after the breakout move. In some cases you will see the stock retrace to the previous resistance/support level, which provides an optimal entry.
To measure the "post breakout" move, simply follow these steps
- Subtract consolidation resistance from consolidation support to establish consolidation height (consolidation resistance - consolidation support = consolidation height).
- Add/Subtract the consolidation height to/from the consolidation breakout point depending on whether it's a bullish or bearish breakout.
- Place your target accordingly.
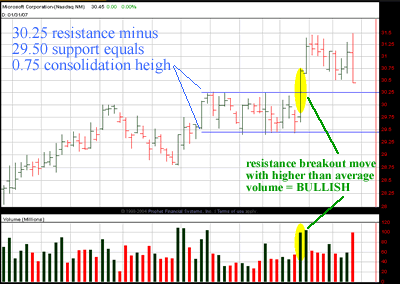
The chart below displays MSFT's 3-month daily bars chart. Note the consolidation patter with resistance at 30.25 and support at 29.50. This results in a consolidation height of 0.75. Since this was a bullish consolidation breakout, add the consolidation height, 0.75, to consolidation resistance, 30.25. This equates to a measured move of 31.00 (30.25 + 0.75 = 31.00). Place your target on the trade at 31.00.
Andy Swan is co-founder and head trader for DaytradeTeam.com. To get all of Andy's day trading, swing trading, and options trading alerts in real time, subscribe to a one-week, all-inclusive trial membership to DaytradeTeam by clicking here.
|


 Free Festival of Traders Videos