| Rambus Inc. (RMBS) Looking Bullish |
| By Andy Swan |
Published
01/29/2007
|
Stocks
|
Unrated
|
|
|
|
Rambus Inc. (RMBS) Looking Bullish
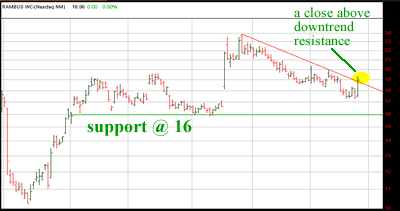
Rambus Inc. (RMBS) closed above downtrend resistance on Friday. Some technical traders prefer two consecutive closings above downtrend resistance before saying it is broken. I am one of them. Now that it's closed above the trendline once, it's essential to watch today's price action -- most importantly the closing price.
Another technical parameter that caught my eye on the 6-month daily bars chart of RMBS is support at 16. In the event the downtrend line break fails and RMBS begins moving lower, I will monitor 16 closely. Recent support and previous resistance turned support at 17 should also be noted.

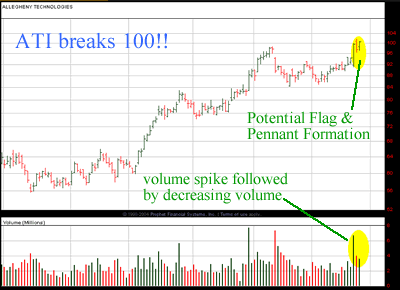
Recently Allegheny Technologies Inc (ATI) broke 100 -- a major psychological barrier known as "par" on the street. This break is significant, and it is important to take a look at the chart when you see a move through this price level. In this case, ATI is forming a potential bullish Flag & Pennant formation, which indicates potential upside continuation.

Note the spike in volume on the upside move through 100. The decreasing volume on the sideways price action thereafter coincides with what you expect to see in regard to a Flag & Pennant. The flag pole was created on a move from 92 to 100, equating to a flag pole height of 8 points. To establish the measured move, simply add the 8 points to the breakout from 100. ATI should see 108 if this formation pans out.
Andy Swan is co-founder and head trader for DaytradeTeam.com. To get all of Andy's day trading, swing trading, and options trading alerts in real time, subscribe to a one-week, all-inclusive trial membership to DaytradeTeam by clicking here.
|