|
A Mid-Week Look at the Markets
In a move that may have surprised a few watchers, the Fed kept the central bank's overnight rate at 5.25%. Some were expecting a 1/4 point cut, even though we just learned that the economy grew by 3.5% (annualized) in Q4 of last year. So far, it appears the market liked the news, even though inflation worries are still valid.
Today's analysis is based on the charts as they were after the announcement, but before the close of trading. Things could have changed between now and then, so be sure to note if the picture look different by the time you read this.
NASDAQ Commentary
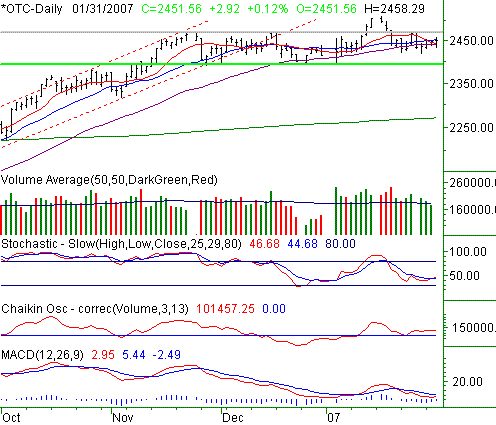
As of right now, the NASDAQ is up 2.92 points, or 0.12%, last traded at 2451.56. That's higher by 16.07 points for the week (+0.66%). However, in the grand scheme of things, we still can't say we're overly impressed by any bullish effort.
What's our problem? Resistance, to put it bluntly. We know we've been out with that song and dance for a while, but then again, the NASDAQ has been bumping into a ceiling for a while too. It's the grey line at 2470. Aside from a short pop above it three weeks ago, we haven't been able to get past that hurdle despite a few attempts to do so. Until we do, we really won't care what happens in a single day.
We have a stochastic buy signal, the Chaikin line says the volume trend remains bullish, and we're probably on the verge of a bullish MACD crossover. It's just that pesky composite that won't behave. We think 2470 is the key.
Of course, that support line (green) at 2394 is still out there, though not a factor right now.
Side note: Notice how the 10-day moving average (red) and the 20-day moving average (blue) are about to move under the 50 day line (purple). In fact, the 10-day line may have already done it - a testament to how flat things have been of late. Based on this alone, we'd actually be very apt to at least start entertaining bearish possibilities.
NASDAQ Chart

S&P 500 Commentary
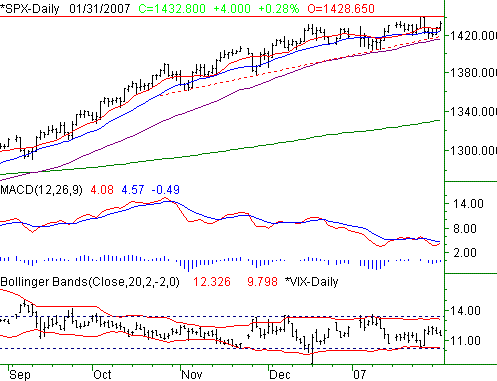
Today's 0.28% rally for the S&P 500 is respectable, even if a little inspired by a bullish interpretation of the Fed's decision. With a little follow-through on yesterday's rise, the SPX now lies above the 10- and 20-day moving average lines. In fact, it seems to have used them as a springboard.
However, as with the other two indices, one day's worth of strength isn't a big deal. We'd need to see a new high above 1440.70 reached before it meant anything to us. That's the horizontal red line on our chart below.
In the meantime, a straight support line has become a factor, as has the 50 day moving average line. The former is dashed, while the latter is purple. Both are around 1416, and seem to be rising at about the same pace. As long as they hold up, we're not going to worry too much about any temporary dips.
By the way, we're still 7.6% above the 200 day moving average line (green). This has frequently been the limit of to what extent the index could rally. The exceptions, however, tend to be enormously bullish (e.g. 1999). So, either we're wrong to be pessimists - which wed have no problem admitting if we were. Or, we're really pressing our luck.
S&P 500 Chart

Dow Jones Industrials Commentary
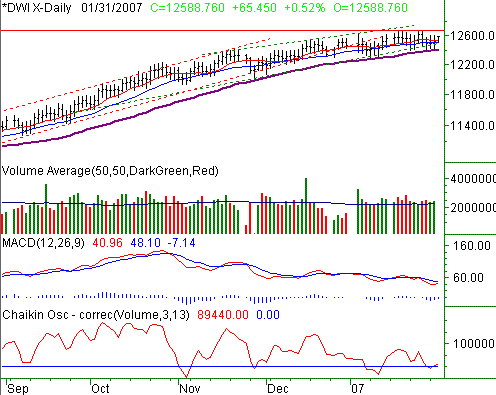
The Dow Jones Industrials are up an average of 0.52% today - the best showing of all three indices. That 65.45 rally leaves the index at 12,588.78 at last look. On a weekly basis, we're ahead by 101.74 points, or up 0.81%. Again, that's tops for all three of these indices.
The move staved off a possible break under support at 12,485 (see the lower of the two thin, dashed, green lines). In fact, the rebound pushed the Dow back above its 10- and 20-day lines, after the index found some support at the 50 day line early in the week.
So we're bullish again? Not quite. From here, only a true 'new high' would convince us. That's the horizontal red line on the chart, currently parked at 12,670.
In the meantime, we've zoomed out quite a bit again to reiterate a key issue. There just seems to be no pep left in the chart. The new bullish channel is much less enthusiastic than the prior one (framed by red, dashed lines), and even the new one seems to be getting tired. Perhaps it's just a short-term consolidation period before the next leg higher. However, between seasonality trends and amazing complacency levels, our concern still stands about what this weakening may mean.
Dow Jones Industrials Chart

Price Headley is the founder and chief analyst of BigTrends.com.
|