| Corcoran Technical Trading Patterns for February 1 |
| By Clive Corcoran |
Published
02/1/2007
|
Stocks
|
Unrated
|
|
|
|
Corcoran Technical Trading Patterns for February 1
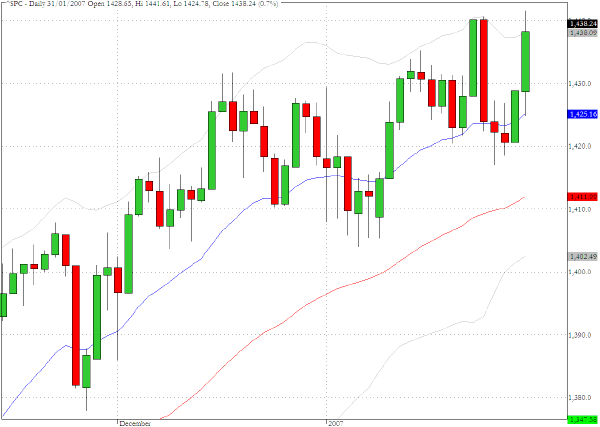
The nuances of the FOMC statement pleased the equity market yesterday as a more robust economy and evidence of contained inflation seemed to outweigh the diminished chances of any imminent easing. The bias would actually now seem to be erring on the side of a further tightening but this may have encouraged the bond vigilantes that the Fed has room to apply further micro management of the soft landing. The S&P 500 (^SPC) touched intraday a new multi-year high at 1441 but a late retreat left the index just below the recent multi year high close achieved on January 24.
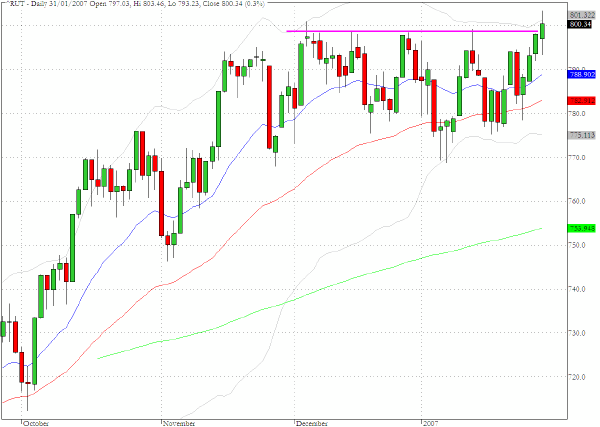
Further indication that the FOMC statement was well received can be seen from the attainment of a new historic high for the Russell 2000 (^RUT), which managed to close above 800 for the first time. The 1.1% gain appears to have opened a trap door above the recent congestion range that has kept the index confined below 800 since early December. The S&P Midcap (^MID) also registered an historic high at 833.
As always, the celebrations need to be tempered by the tendency of the markets to need two sessions to really digest FOMC announcements and the breakout must still be regarded with some scepticism until the dust settles.
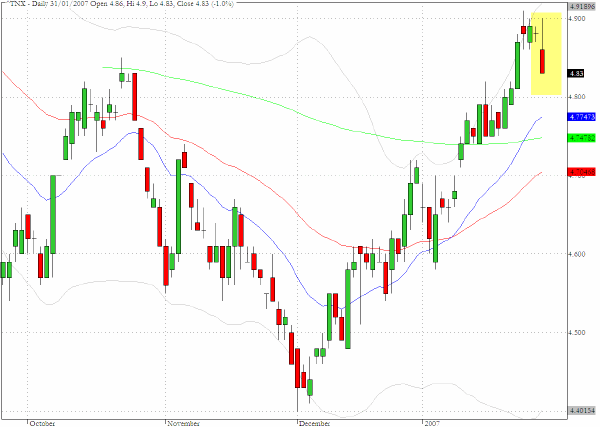
The Treasury market’s reaction to yesterday’s FOMC statement and additional evidence of fairly robust growth was, somewhat surprisingly, to retreat from the recent upward path that yields have been taking. The dollar declined on the reaction from the interest rate sector but we sense that there could be some erratic trading ahead for both the forex and bond markets as the yield outlook seems less clear now than before the FOMC meeting.
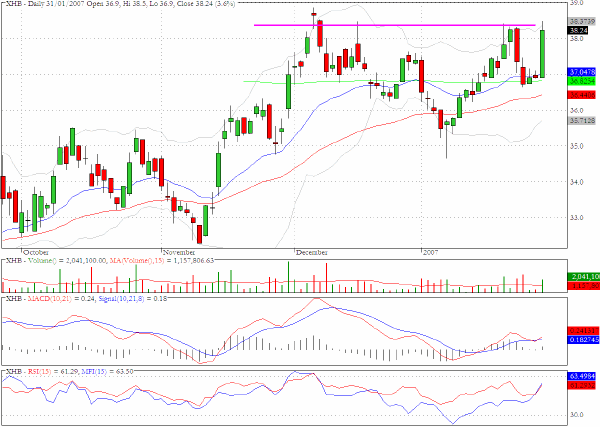
One sector that has been showing erratic trading recently is the homebuilders. XHB has whipsawed back and forth over the last week and the sector also faces a test of the top of the range that extends back to early December.
TRADE OPPORTUNITIES/SETUPS FOR THURSDAY FEBRUARY 1, 2007
The patterns identified below should be considered as indicative of eventual price direction in forthcoming trading sessions. None of these setups should be seen as specifically opportune for the current trading session.
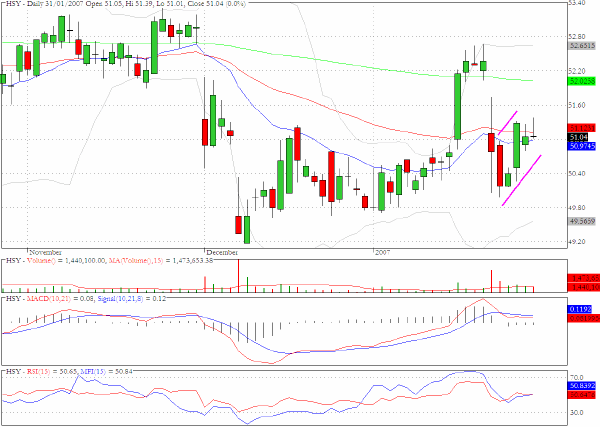
Hershey (HSY) has the appropriate characteristics for a bear flag setup.
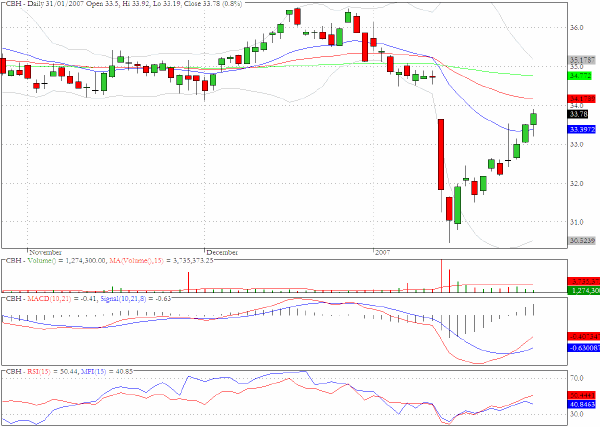
Commerce Bancorp (CBH) faces a real hurdle at the $35 level and we will keep it on the radar screen over the next few sessions.
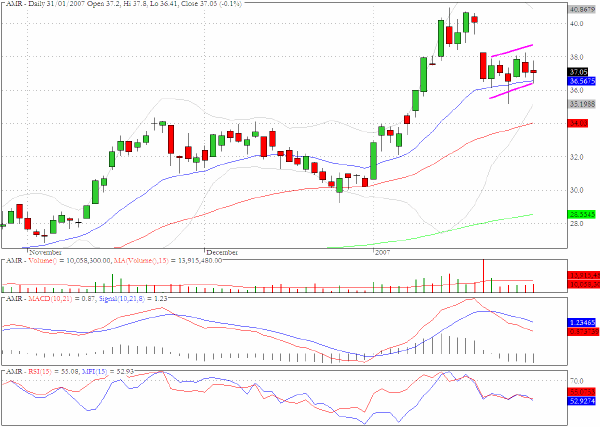
American Airlines (AMR) also could be setting up in a bear flag formation
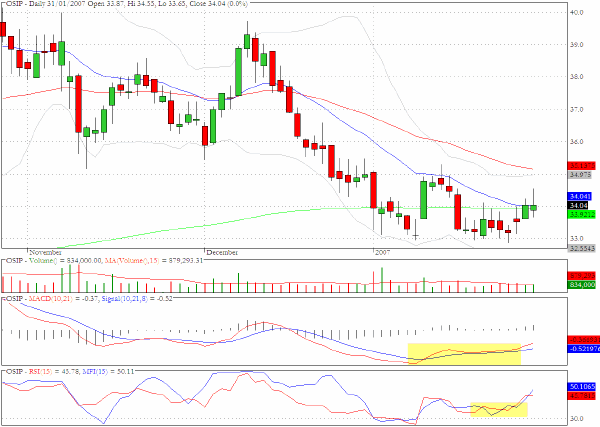
OSI Pharmaceuticals (OSIP) seems to be emerging from a basing pattern and there are some positive divergences that could propel it higher.
Clive Corcoran is the publisher of TradeWithForm.com, which provides daily analysis and commentary on the US stock market. He specializes in market neutral investing and and is currently working on a book about the benefits of trading with long/short strategies, which is scheduled for publication later this year.
Disclaimer
The purpose of this article is to offer you the chance to review the trading methodology, risk reduction strategies and portfolio construction techniques described at tradewithform.com. There is no guarantee that the trading strategies advocated will be profitable. Moreover, there is a risk that following these strategies will lead to loss of capital. Past results are no guarante of future results. Trading stocks and CFD's can yield large rewards, but also has large potential risks. Trading with leverage can be especially risky. You should be fully aware of the risks of trading in the capital markets. You are strongly advised not to trade with capital.
|