| Corcoran Technical Trading Patterns for February 5 |
| By Clive Corcoran |
Published
02/5/2007
|
Stocks
|
Unrated
|
|
|
|
Corcoran Technical Trading Patterns for February 5
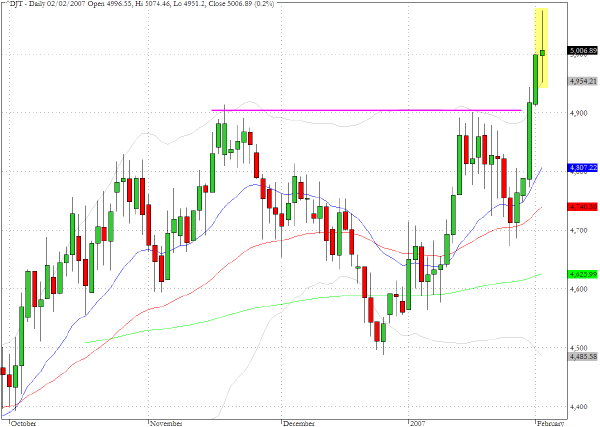
The Dow Jones Transportation index was among many of the indices to reach another historic high in Friday's trading as it peeked above 5,000 for the first time. The positive reaction to Wednesday's statement from the Fed saw the index push through 4900 and thus surpass the previous all time high from mid-November but the almost vertical ascent pattern has now been punctuated with the Doji candlestick with long tails which is sometimes seen at inflection points.
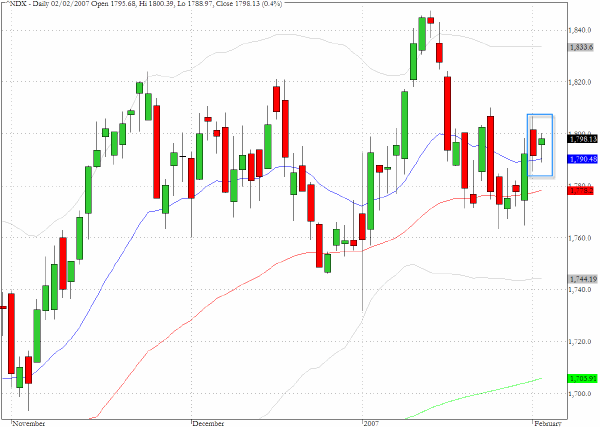
The Nasdaq 100 (^NDX) has been reluctant to contribute to the recent celebratory atmosphere that has seen new historic and multi-year highs for most of the equity indices. On Friday, the index produced a narrow range session as it moved up by 0.4% and closed above the 20-day EMA. In the process an inside day was recorded on the daily chart.
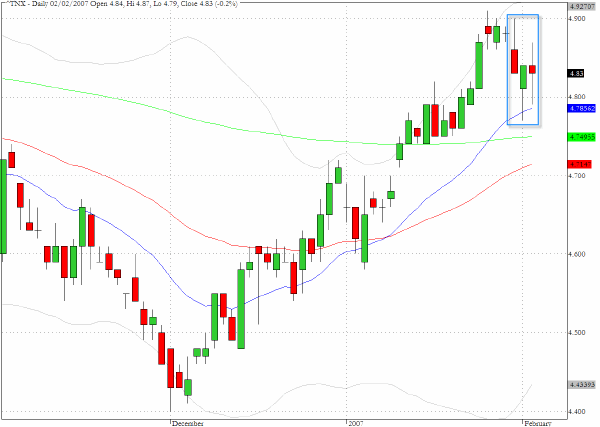
As noted last week, we expected to see uncertainty and indecisive behavior in the Treasury market as last week’s economic data and the FOMC announcement seemed to muddy the waters more than creating any clarity as to the future direction of short term interest rates. The release of employment data on Friday, which was slightly less than the consensus forecast, did nothing to throw further light on the matter and the indecision continued.
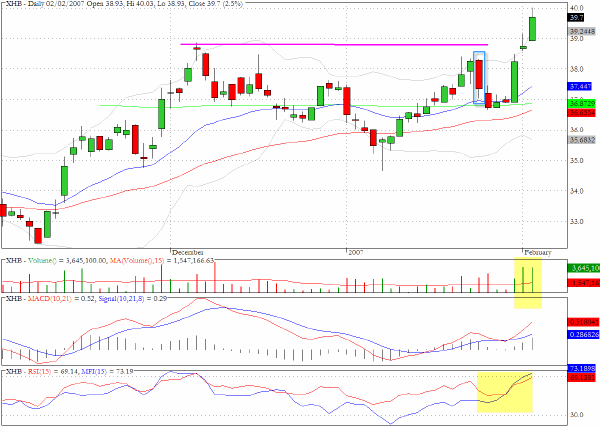
The chart for the homebuilding sector (XHB) over the last three sessions shows a remarkable turn around for the sector. The long red candlestick that appeared on January 25 could have marked the failure at a lower high to challenge the early December high. The sector appears now to be breaking away but there is still a lot of ground to cover for the index to head back towards the $46 plateau where the index was in the spring of 2006.
TRADE OPPORTUNITIES/SETUPS FOR MONDAY FEBRUARY 5, 2007
The patterns identified below should be considered as indicative of eventual price direction in forthcoming trading sessions. None of these setups should be seen as specifically opportune for the current trading session.
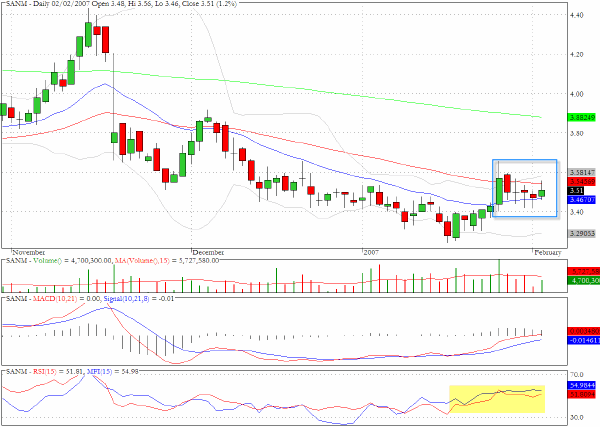
Sanmina (SANM) has a flag like pattern and there is recent evidence of accumulation.
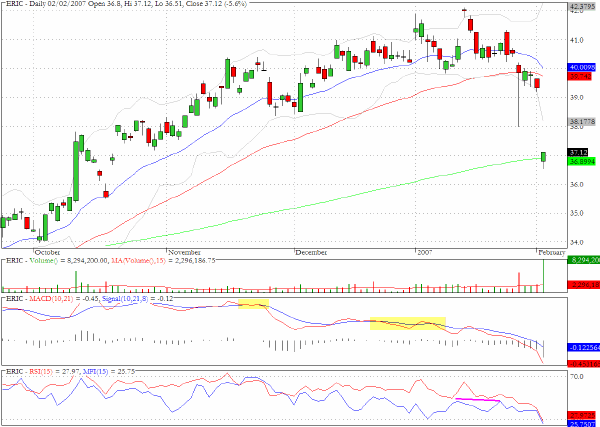
The chart for Ericsson (ERIC) contains some negative divergences that could have offered clues as to Friday's large gap down on more than three times the average daily volume. The fall was arrested exactly in the vicinity of the 200-day EMA, but there could be capacity for further downside to the $34 level in the longer term.
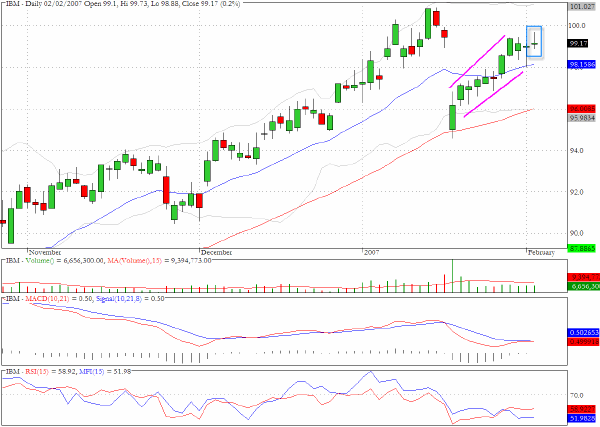
We have been watching IBM as the pullback pattern has been developing. The Doji/spinning top candlestick from Friday's trading that topped out just below $100 might be a precursor to another bout of weakness.
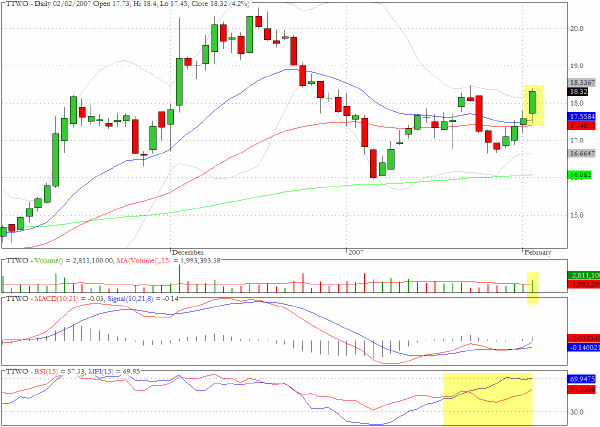
The chart for Take Two Interactive (TTWO) has been experiencing significant accumulation and positive divergences and Friday's move up on above average volume leaves the stock poised for further progress that could propel it towards the top of the recent range.
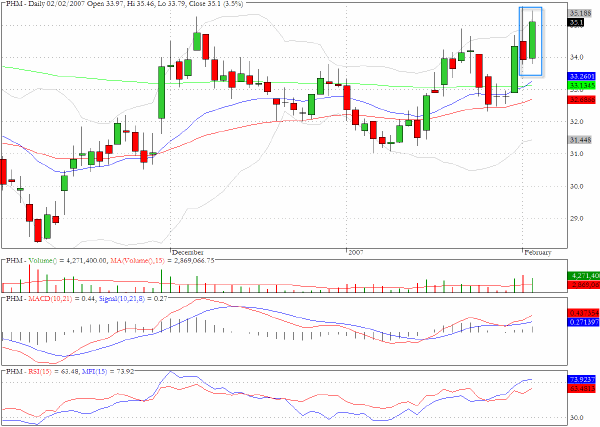
Pulte Homes (PHM) registered an intriguing inside day on Friday and is now poised for a potential breakout above its recent upper limit. Another homebuilder, TOL, showed more evidence of wanting to break above its recent highs, and as we noted above the sector seems to be benefiting from a combination of renewed positive sentiment for the sector as well as some obvious short covering.
Clive Corcoran is the publisher of TradeWithForm.com, which provides daily analysis and commentary on the US stock market. He specializes in market neutral investing and and is currently working on a book about the benefits of trading with long/short strategies, which is scheduled for publication later this year.
Disclaimer
The purpose of this article is to offer you the chance to review the trading methodology, risk reduction strategies and portfolio construction techniques described at tradewithform.com. There is no guarantee that the trading strategies advocated will be profitable. Moreover, there is a risk that following these strategies will lead to loss of capital. Past results are no guarante of future results. Trading stocks and CFD's can yield large rewards, but also has large potential risks. Trading with leverage can be especially risky. You should be fully aware of the risks of trading in the capital markets. You are strongly advised not to trade with capital.
|