| Weekly Outlook in the Stock Market |
| By Price Headley |
Published
02/5/2007
|
Stocks
|
Unrated
|
|
|
|
Weekly Outlook in the Stock Market
NASDAQ Commentary
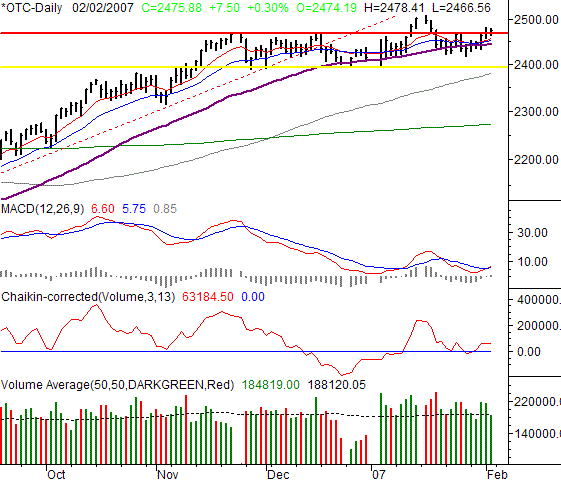
The NASDAQ's close of 2478.88 was the result of a 7.5 point rally on Friday - a gain of 0.3%. For the week, the gain of 1.66% (+40.39 points) matched that of the Dow. Perhaps more importantly, it was a close just a hair above that key resistance at 2470 we've been talking about. Talk about walking a tight rope! It was only the first close above it, so it's not like things are in cement here.
You'll find the many of the same ideas we discuss about the NASDAQ's chart will be repeated with the S&P 500 commentary. However, it's still worth a look in both places.
We've been preaching the possibility of a pullback for a while, after the composite stopped making progress in late November. However, Friday's rally is putting serious pressure on the upper edge of that horizontal trading range. In fact, it broke it. That move has to make us wonder if the last 10 weeks was simply a consolidation period within a bigger-picture uptrend. The buyers have remained persistent, and made a reasonably strong statement at the end of last week. If it was just a consolidation mode, then perhaps we should be thinking like bulls again.
As is stands right now, it's a bit too soon to say. We'd like to see a couple more closes above 2470 before making the call, just to verify the conviction of last week's buyers. However, we have to concede that the volume behind last week's buying was pretty darn solid, and bodes well for the bulls.
NASDAQ Chart - Daily

S&P 500 Commentary
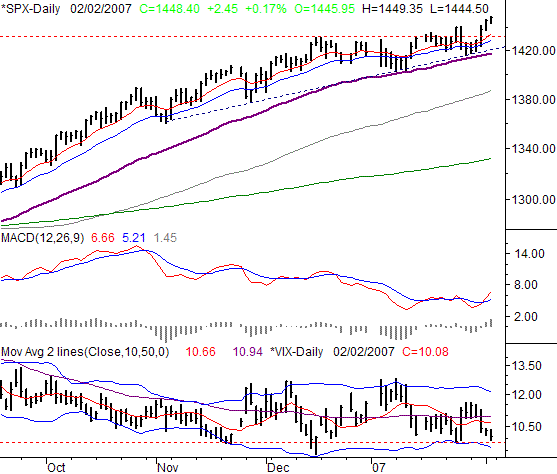
The close at 1448.40 for the S&P 500 on Friday was a new multi-year high close, and obviously left the index past that resistance level of 1431. It was the result of a 2.45 point gain (+0.17%) for the day, and a 1.84% (+26.20) point gain for the week. The SPX's leadership verifies - so far at least - that the pundits who were calling for large caps to lead this year were right.
Let's call a spade a spade - the break to new highs is bullish. And while it's tempting to say the pattern we've seen for moths now is likely to play out again, we're not going to say it just yet. What's that pattern? A small, subtle move into new high levels, then a slightly smaller easing back to a generally bullish support line. Volatile? No, more like choppy.
Why could now be different? December and January could arguable be called a consolidation period (and a bullish wedge, in some regards). That may have been enough time for the market's spring top recoil itself, and the breakout on Friday might be a sign that the spring has been sprung.
Or maybe it's just more of the same back and forth we've been contending with.
If forced to choose, we'll choose conservatively - for the time being - and guess the hot three-day move is likely to result in a dip. While history is part of the foundation for that opinion, we're also keying in on the VIX. Closing at 10.08 on Friday after reaching a low of 9.96, the VIX is essentially back at levels recently associated with a short-term market top. See the red dashed line on the VIX chart; it's at 9.8. The last three times we got near that line, the market was also about to make a small correction. Maybe this time will be different, or maybe not. But if it is different, it would be an uncanny move back into uncharted territory for the VIX. Anything is possible.
Even then, the worst-case scenario is probably a tumble all the way back to the 50 day line at 1418. Or, maybe the straight-line support (blue, dashed) around 1421. Any pullback is likely to get stopped and reversed there.
Side note, the SPX is only about 100 points from its all-time high of 1552.85, hit back in March of 2000. It would take a 7.2% move from current levels to reach it, which would actually be quite a move. However, if the index can indeed make it there and a little beyond that level - probably sometime in the middle of the year - the even has the potential to start a bullish firestorm. Just something to keep in mind. Of course, we may not get there directly (in a straight shot) from here.
S&P 500 Chart - Daily

Dow Jones Industrial Average Commentary
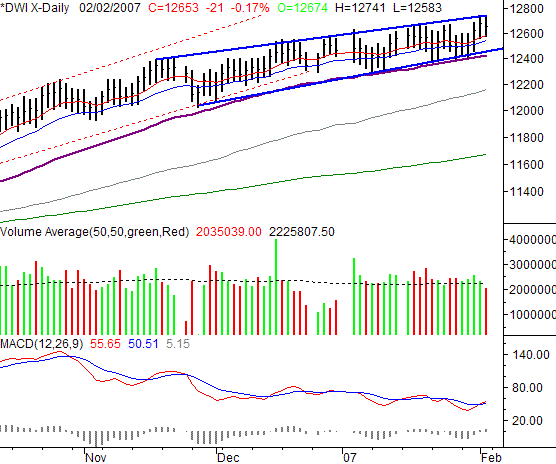
On Friday, the Dow Jones Industrial Average gave up 21 points (-0.17%) to end the day at 12,653. That was still a gain of 1.33% for the week, as the Dow ended the session 166 points above where it closed out the week before.
No need to repeat the above comments here....the same basic idea still applies. The only thing we'll add - which suggests we're set for s short-term retreat - is being at the upper edge of that generally bullish zone (framed by bright blue lines). Other than that, things are bullish across the board -- momentum, support at the key moving averages, and even that generally bullish channel.
The likely worst-case scenario here is a dip back to the recent support areas. That's 12,422 at the worst, but possibly even higher than that.
Dow Jones Industrial Average Chart

Price Headley is the founder and chief analyst of BigTrends.com.
|