NASDAQ COMMENTARY
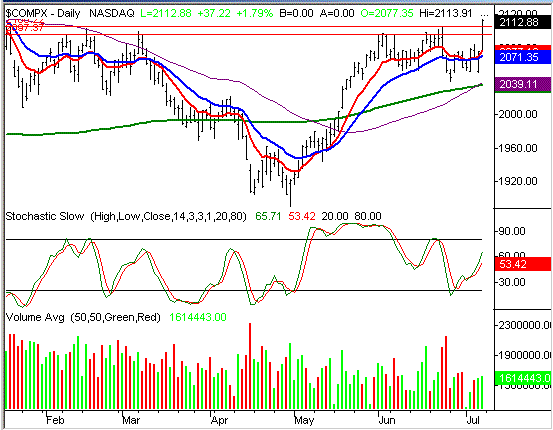
Impressive, to say the least. With Friday's action, we find the NASDAQ effectively knocking on the door of new highs for the year, albeit it in a rather gut-wrenching fashion. We say effectively approaching new highs, because the high of 2191.60 from the first trading day of the year is something of an outlier. Most traders were just waiting to sell in calendar 2005 (instead of 2004) for tax purposes, so that high may have been a little unmerited. The same goes for the second trading day of the year (January 4), where the selloff continued. We really didn't catch our breath until January 6, when the high was 2103. So taking out those unusual days from the analysis, the NASDAQ actually moved to new highs.
As for gut-wrenching, that's just a reference to this week's volatility. Stocks were hammered when oil hit $61 per barrel. Then the London bombing drove stocks down even further on Thursday, but only for a few hours. By the end of that day, stocks had more then fully recovered, and were setting up what would be a heroic Friday. In fact, as evidence of this volatility, this week's 63 point range is the biggest we've seen since the heart of the May rally. The tough part for traders is that (1) the reversal came out of nowhere, and (2) it was mostly unfounded, at least logically speaking (more on that below). Nonetheless, it happened, and now we gotta deal with it, even if it doesn't make sense.
Our prior resistance points had been 2100, where we topped out in June, and secondary resistance was at 2106, where we topped out in February. Friday's high of 2113.91 took out both of these, so needless to say, this has to at least out any bearish opinions on hold. The problem is, the huge rally over the last two days of the week were a little too red-hot to be healthy, or sustained. Despite what appears to be momentum. The reality is that the bullish move still lacked volume. Yes, volume is naturally going to be a little light in July - that's not the issue. The issue is that these low-volume rallies haven't had much follow-through all year long. And with some gains to be had, the odds now favor at least a small pullback in the coming week.
On the other hand, despite a pace that can't be sustained, some major technical resistance was broken (as discussed above). Aside from the barrier at 2100, the NASDAQ also marched back above its 10 and 20 day lines. More than that, the 10 day line (red) seems to be serving as support now. Can the unlikely happen? Well, lightning can strike twice. The current chart looks a whole lot like late April. The NASDAQ was looking very weak then, yet found no resistance at the moving averages in early May. Against the odds, the composite actually accelerated into the rally as May went on, giving us four solid weeks of big gains. So we wouldn't plan on any corrections just yet.
The test for this uptrend will come next week. Can the composite stay here, or will the weight of recent gains be too much? In either case, this chart has turned more bullish than bearish, despite the likely dip were due next week. If the bulls are as confident during that selloff (i.e. if they start buying on a pullback), we'll start looking at upside targets. That's a big if though.
Support is now at 2077 and 2071.
NASDAQ CHART

S&P 500 COMMENTARY
The S&P 500 ended up pulling out a nice week as well, although not quite as impressively as the NASDAQ did. For the shortened week, the SPX gained a little more than 17 points, to close at 1211.86. Friday's surge was enough to push this large-cap index back above the 10 and 20 day moving average lines, but it's still 17 points below the high for the year. And technically speaking, even after last week, the chart is still just range-bound. Unless we get above 1229.11 (from March), we can't get too excited.
Other than that, there's not a lot to say. This chart isn't quite as compelling as the NASDAQ's is. The DMI lines are choppy, and the MACD indication is still technically bearish. We do have a stochastic buy signal though. With all those mixed signals, we'll look to the Dow for some guidance.
S&P 500 CHART

DOW JONES INDUSTRIAL AVERAGE COMMENTARY
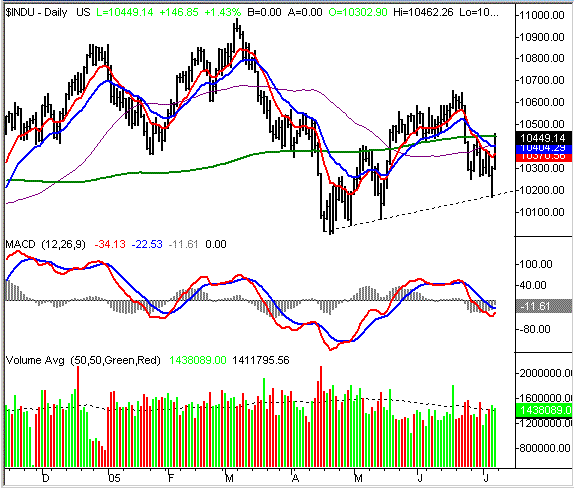
If it seems like we're getting progressively pessimistic with our charts, it's becasue we are. The NASDAQ looks like it launch, while the S&P looks confused. The Dow, even after Friday's 147 point rally, still appears to be in trouble. The surge was enough to drag the index above the 10, 20, and 50 day lines; all are at least the beginning of bullish signals. However, the 200 day moving average (green) capped the Dow's run, ending its week at 10,449.14. For the week, the Dow gained 146 points, and was the weakest of all the indexes (as it has been for a month now). As much as we'd like to say that the Dow is just ramge bound too, we actually can't. The momentum is still to the downside here, as we continue to make lower highs, and struggle to recover.
One thing to note is the support line (dashed) currently at 10,180. This is something we discussed in the MidWeek Update, but it was verified as a support line on Thursday. This is where the Dow's rally started then, acting as a springboard for Friday's run. We definitely want to keep this line plotted going forward - it may end up being the last bastion of hope again down the road.
As for where the Dow is headed next, it's still not perfectly clear (not that it ever is). The rebound late in the week was encouraging, but it's doubtful that these kinds of gains can be kept up. In fact, it's these big gains that invite profit-taking. And considering the general tone of things as we head into earnings season, we're expecting more disappointment than elation. We could get a few more straggling bulls early in the coming week, but unless this chart can crack the recent high of 10,650, this rally is pretty well doomed. On the other hand, the support at 10,180 (and rising) is strong too. So although the momentum is bearish, it looks like the Dow is trapped in something of a range as well.
One thing to note that still leaves us unenthused - volume. The last two days were spectacular, but there weren't a lot of people who thought so. The rest of the buyers need to show up to the part y soon if there's going to be any chance at keeping this thing alive. We think those chance are slim, but we shall see.
DOW JONES INDUSTRIAL AVERAGE CHART

Price Headley is the founder and chief analyst of BigTrends.com.