Although the threat of continued rate hikes kept the financial stocks in check for the past several months, these companies have started to move higher again. The S&P Financial Sector Index (SPSY) has rallied 5.5% since the end of the first quarter. That's certainly not the best performing sector since then, nor are these stocks the best performers since the beginning of the year. However, these companies have posted one of the strongest turnarounds over the last three months - there was just no fanfare around it because there was no 'news' justify it. Based on the charts we see, the financial stocks could be the sleeper for the second half of 2005, with the insurers leading the way.
As for the underlying dynamic, much of this has to do with interest rates. Rising rates will keep the industry from rallying, as the market views rising rates as a liability for the financial-based stocks (which is not entirely true). Sensing that the Fed is close to being done with the rate hikes, these stocks are starting to draw some interest again. The financial sector in general is rising, but that doesn't necessarily include all of the underlying industries - banks seem to be in trouble. A couple of the other industries, though, are more than offsetting that weakness in the regional and national banking stocks. The insurers are one of them, while the broker/dealers are another.
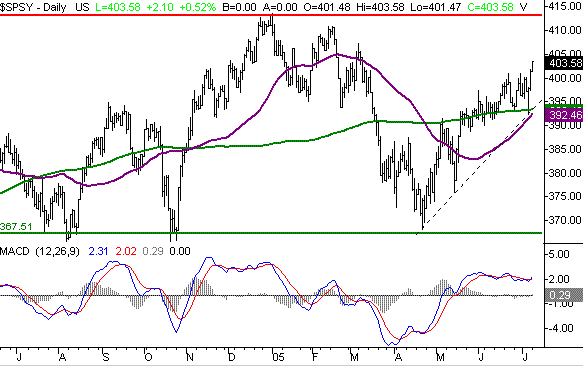
First, let's take a look at the S&P Financial Sector Index (SPSY). This chart looks (and is) volatile. We've been as high as 413 and as low as 368 this year - a 45 point (or 12 percent) trading range. But after hitting support around 368 for the third time in less than a year, this sector finally started to make a consistent rebound. During the second quarter, the index crossed back above the 50- day line, and then the 200 day line. This chart is still going higher too, but this time, at least in a controlled fashion. That's the attraction - the consistency.
S&P Financial Sector Index (SPSY) - Daily

We're setting a target of 455 for the S&P Financial Sector Index (SPSY). There is resistance at 413 though. Not only is that this year's high, but that's about where the index topped out in early 2004. If it looks like there's going to be trouble there, we'll pull the plug on this bullishness. As for stops, any close under the 50 day line will negate this opinion. It's currently at 392.
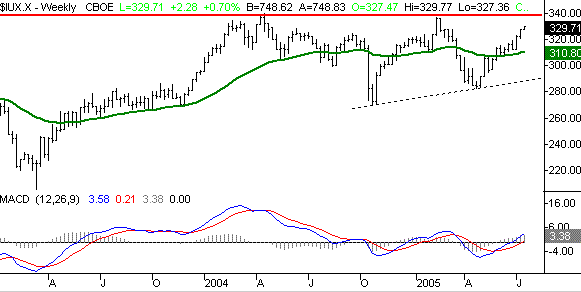
The major contributors to this strength are the insurance companies, with property and health insurers doing much better than the life insurance providers, although all are doing well. (Ironically, the insurers are least affected by interest rates.) We'll use a weekly chart of the S&P Insurance Index (IUX) to illustrate the upside movement. It's been a roller coaster for sure, but over the last three months, this was the best place to be invested within the sector - the average gain here was about 10.6%, topping all the other financials. We look for this trend to quietly continue, as we set a target of 372. Stops on this bias come with a close under the 50 day line, currently at 311 (not shown). Note that this index has a similar resistance line as the broad financial index does. So, if there's trouble around 338, that may set up a downside move.
S&P Insurance Index (IUX) - Weekly

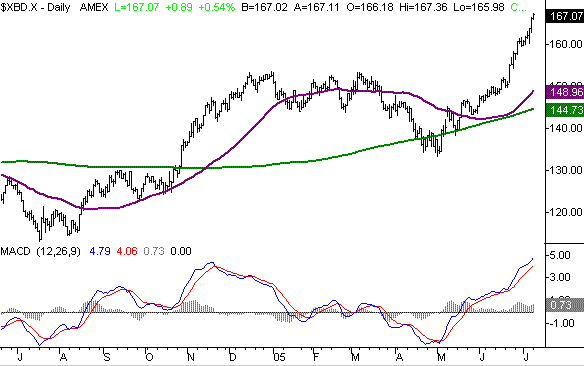
Our broker-dealer proxy is the AMEX Broker/Dealer Index (XBD), and these stocks have been very impressive as well. However, they've really run away over the last two months, and are ripe for a pullback. We're going to keep tabs on these stocks, and look for a better entry opportunity down the road. As you can see, the current reading of 167 is 16 percent above the 200 day average. We're generally not afraid of buying into strength, but this groups' trend looks like it could burn out real soon. We'll wait for the brokerage firms to make a soft landing before we take any interest here.
AMEX Broker/Dealer Index (XBD) - Daily

Price Headley is the founder and chief analyst of BigTrends.com.