| Corcoran Technical Trading Patterns for February 8 |
| By Clive Corcoran |
Published
02/8/2007
|
Stocks
|
Unrated
|
|
|
|
Corcoran Technical Trading Patterns for February 8
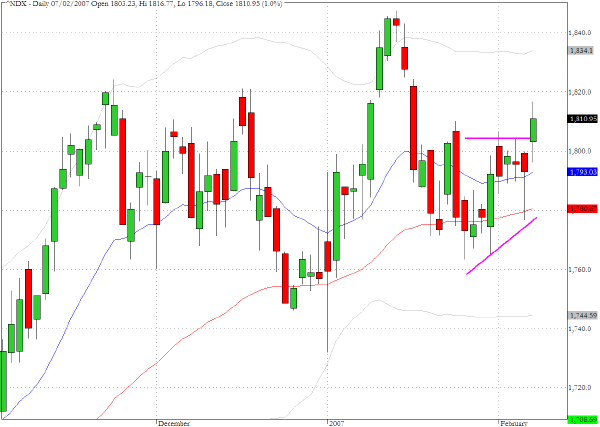
The Nasdaq 100 (^NDX) recorded a more decisive move yesterday, as we anticipated in yesterday's column based on the wedge formation. The index moved up one percent to 1810, partly inspired by Cisco's earnings, but as in the case of the stock itself (see below) overhead supply/resistance was encountered that left the candlestick with a long upper shadow.
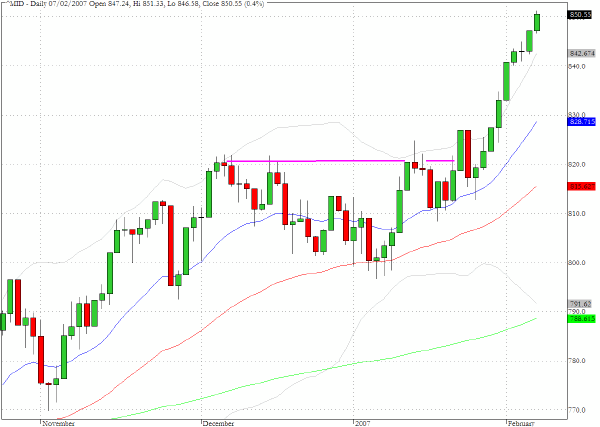
The S&P Midcap index (^MID) continues to show relative strength as the ascent pattern is becoming parabolic. The index is revealing more momentum than even the strong showing from the the small cap index, the Russell 2000 (^RUT).
Unlike the S&P 500 which needs to cover a further five percent before it can establish a new historic high the midcaps stocks have registered an almost unbroken string of all time highs over the last two weeks.
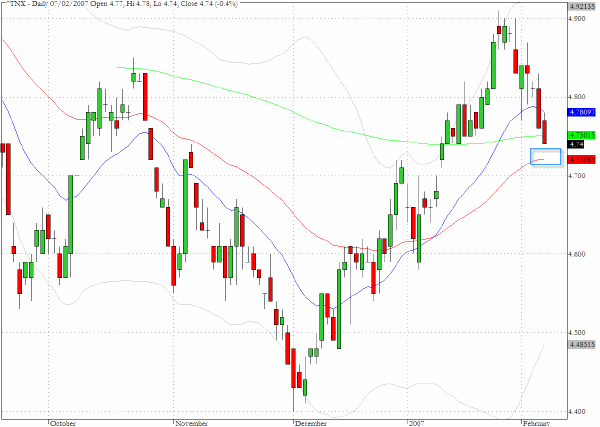
One of the factors that has assisted the equity indices is the decline in Treasury yields over the last two sessions. The yield on the ten year note has retreated to 4.74% but is now close to the convergence of the 50- and 200-day EMA’s and some consolidation is to be expected at current levels.
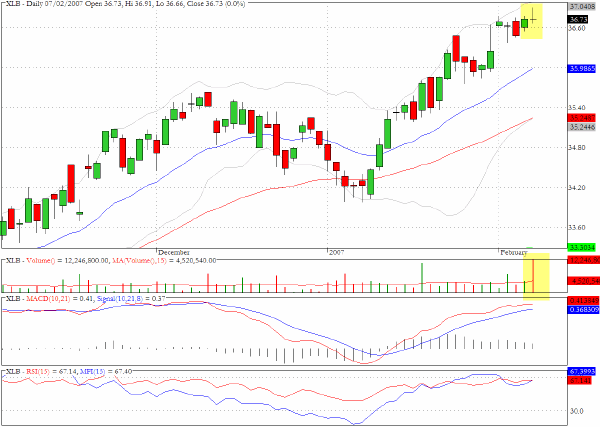
The ETF for the basic material sector, XLB, recorded a tiny Doji candlestick on very heavy volume and should be monitored today for indications that a short term trend reversal may be emerging.
TRADE OPPORTUNITIES/SETUPS FOR THURSDAY FEBRUARY 8, 2007
The patterns identified below should be considered as indicative of eventual price direction in forthcoming trading sessions. None of these setups should be seen as specifically opportune for the current trading session.
Cisco Systems impressed the markets with a robust earnings report but the reversal as the stock approached the January high of $29 left a rather striking red candlestick on the chart.

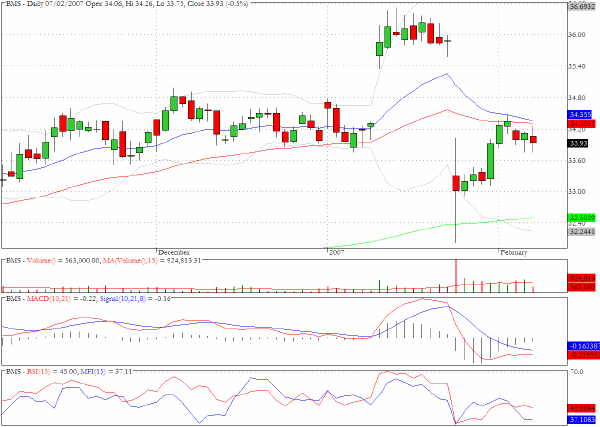
Bemis (BMS) has a bearish pullback channel and could encounter resistance at the confluence of the 20- and 50-day EMA's.
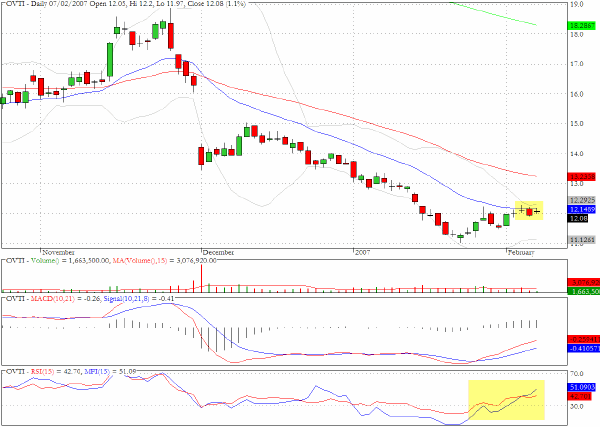
The volatility bands for OmniVision (OVTI) have constricted and there is evidence of accumulation.
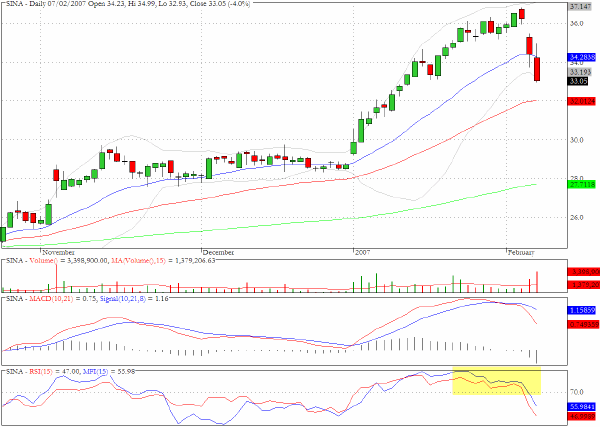
Sina Corporation (SINA) has sold off for two days and the momentum and money flow charts could have provided us with clues as to the likelihood that a correction was imminent.
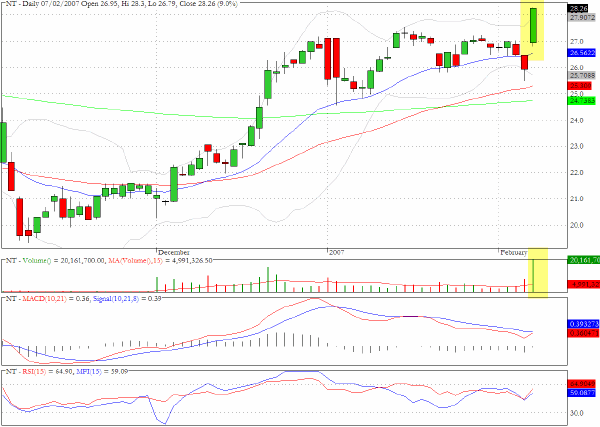
Yesterday we suggested that Nortel (NT) was looking vulnerable but the company announced further re-structuring measures and the stock put in a strong performance that inevitably would have squeezed some short traders quite hard. It remains to be seen whether new longs will propel the stock to further gains.
Clive Corcoran is the publisher of TradeWithForm.com, which provides daily analysis and commentary on the US stock market. He specializes in market neutral investing and and is currently working on a book about the benefits of trading with long/short strategies, which is scheduled for publication later this year.
Disclaimer
The purpose of this article is to offer you the chance to review the trading methodology, risk reduction strategies and portfolio construction techniques described at tradewithform.com. There is no guarantee that the trading strategies advocated will be profitable. Moreover, there is a risk that following these strategies will lead to loss of capital. Past results are no guarante of future results. Trading stocks and CFD's can yield large rewards, but also has large potential risks. Trading with leverage can be especially risky. You should be fully aware of the risks of trading in the capital markets. You are strongly advised not to trade with capital.
|