|
A Mid-Week Look at the Markets
The bulls just refuse to die. No, they may not be living all that impressively, but we have to admire - and incorporate - the fact that they're not giving in. The Dow hit all-time highs before fading back to even for the session yesterday, though the NASDAQ was up big-time, still playing catch up from its lagging a few weeks ago. The S&P 500 was somewhere in between, though it hit multi-year highs as well.
While we were originally thinking a stagnant market would lead the buyers to lose interest and yield to the bulls, perhaps we should consider the reverse possibiity -- maybe the stagnation will give any would-be buyers a chance to think about it and jump back in.
NASDAQ Commentary
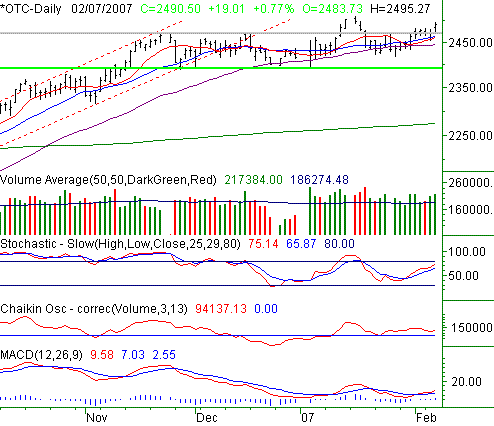
On Wednesday, the NASDAQ closed 19.01 points higher (+0.77%), to end the session at 2490.50. For the week, the composite is up by only 14.62 points though, or 0.59% (thanks to a lackluster Tuesday). However, the gain puts the NASDAQ well above the major resistance line we had been using - at 2470. In fact, it's been poking above that line for the past five sessions; Wednesday's move just extended the reach.
As it stands right now, this is bullish...resistance has been broken. However, we also have a bullish MACD crossover, the volume trend has stayed positive, and like we said above, the index is verifying all of this with actual results.
In retrospect (and perhaps something of a lesson for future reference), the flat zone framed by the green and grey lines are looking like a consolidation period. That's just the fancy way of saying the bulls were taking a break, but the bears weren't interested in taking control. In support of the idea, notice the entwined moving average lines. The result is a stalemate and a chart that goes nowhere.
We feel a little better - though not 100% - about making a generally bullish call now, based on this chart. As for where any rally might take us though, we can't guess that just yet. We'll have to keep an eye on the indicator and sentiment tools to best determine that later.
In the meantime, like we said, we're still not totally convinced. However, we can reset our support lines from 2394 (green) to 2444. That's where the 50 day line is now (purple), and in general, it's acted as support for several weeks.
NASDAQ Chart

S&P 500 Commentary
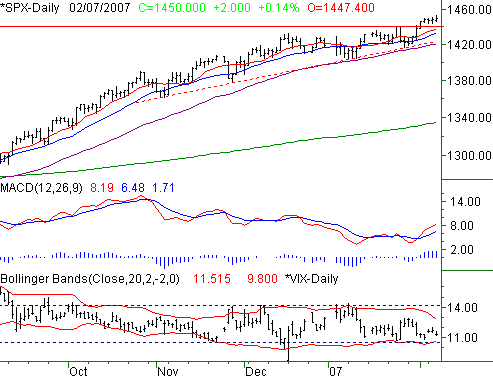
On Wednesday, the S&P 500's close of 1450.0 came on the heels of a 2.0 point gain. Somehow the SPX managed to close at even integers twice in a row. In any case, despite Wednesday's 0.14% gain, the S&P 500 is still only up by 0.11% for the week. That's 1.6 points above last week's close. Though we're generally bullish on the other two charts, and to a certain degree on the S&P 500's chart as well, we also see a couple of warning signs for this chart.
The key red flag here is Wednesday's bar. After hitting a new multi-year high of 1453, the large caps faded significantly, as the index closed in the lower half of the day's range. The concern is just a question - why can't the S&P 500 hold onto most of its gains?
On the other hand, we have to cut the index a little slack - we saw a very big move last week, and has actually put up superior numbers over the last several weeks. It may just be a case where the market (which includes us) is just expecting too much all the time.
So, we'll only get concerned in a bearish way if the 10- and 20-day lines start to break down as support. Notice that the S&P 500 has a pretty wide degree of separation between itself and the short-term averages -- more than the other indices anyway. So, this index could actually fall while the other two rise, and it still wouldn't shake up our opinion too much. Just for reference, the 10-day line is at 1437, while the 20-day average is at 1432.
And yes, the ridiculously low VIX is still a worry. However, it only seems to be a worry for us. Don't assume the VIX can't fall under support around 9.8 and just keep heading lower, uncanny as it may be.
S&P 500 Chart

Dow Jones Industrials Commentary
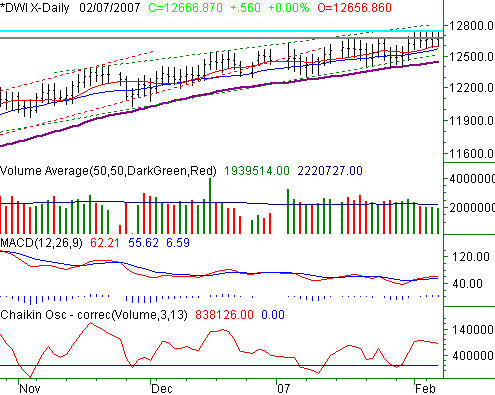
The Dow Jones Industrial Average ended Wednesday's session almost perfectly flat - the 0.56 point gain didn't even register as a percentage move. The same almost applies on our weekly chart, as yesterday's close of 12,666.87 is just 13.38 points above last Friday's close, meaning the index is up by a mere 0.11% since then. It's an interesting change of pace for the Dow, which had been leading the other indices for the last several weeks. Could we be seeing some rotation out of these names and into more aggressive small cap ideas? Maybe - the NASDAQ's renewed strength sure supports the possibility.
The resistance line around 12,670 (grey)? Forget it. The bar has been raised to 12,740 (teal), close to where the Dow has topped the last five sessions. Though it was only a minor move past the former ceiling, it was still a new all-time high.
There's a bit of a red flag to go along with the recent gains though -- the bullish volume over the last five sessions (though one was a losing day) is noticeably less than then bullish volume we saw right before we hit new all-time highs. The problem? It hints that the move didn't garner much participation. Of course, that symptom may just be a function of all the interest shifting away from blue-chip names and into the more aggressive stocks associated with the NASDAQ.
Overall, the bulls still get the nod here. The long-term support lines - namely the 50-day average (purple) and the bottom edge of the bullish 'zones' we've seen - are still doing their job. Even the 10- and 20-day lines (red and blue, respectively) have chipped to hold the Dow up over the last five days. So, while it may not be explosive or impressive, the chart is still pointed upward.
Support is at 12,442, where the 50-day moving average line (purple) currently rests. At this point, that's the only thing that could tip us into the bearish camp.
Dow Jones Industrials Chart

Price Headley is the founder and chief analyst of BigTrends.com.
|