|
Weekly Outlook in the Stock Market
One thing you'll notice by the time you get to the bottom today: the signals are still a little mixed. The NASDAQ still looks like it's struggling, being right back where it was on November 24. The S&P 500 as well as the Dow, however, both still look relatively healthy. We have to prepare for both possibilities, and maybe even prepare for split results.
NASDAQ Commentary
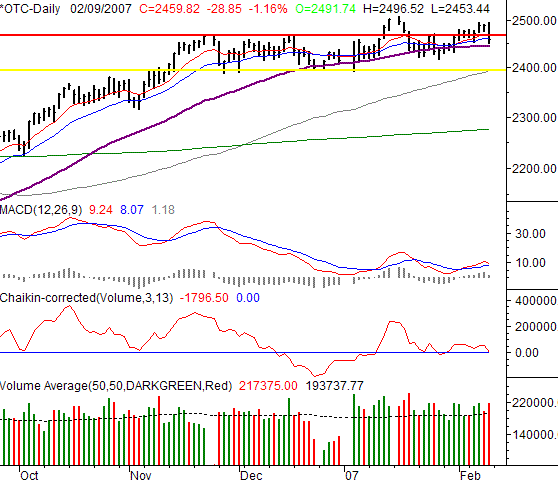
The NASDAQ's 1.16% loss on Friday was the biggest of all indices, leaving the index at 2459.82, lower by 28.85 points. That one day spoiled an otherwise positive week; the composite ended 16.06 points below the prior week's close, losing 0.65% over the last five trading sessions. Of course, this give-and-take is nothing new at all. The NASDAQ is just back at home in the range.
In the middle of last week, it appeared as if the resistance line at 2470 (red) would finally be hurdled for good. By Friday, we were told it still wasn't out of the picture. You'll also recognize that the composite failed to reach a new 52-week high when it peaked only at 2496.52 - the previous peak of 2508.93 was hit in mid-January. So, the lack of retained progress is still as problem here.
To make matters even a little more bearish, we're very near a bearish MACD crossunder, as well as a bearish Chaikin line cross under zero. (On the other hand, it's also worth noting that MACD and Chaikin line signals have been relatively ineffective during this sideways period for the market.)
So, all we're really left with is the moving average lines to measure the NASDAQ's next likely move. As of Friday, we closed under the 10- and 20-day moving averages (red and blue, respectively). In the past, that's been the beginning if a sell signal. However, like the Chaikin and MACD tools, such crosses haven't meant a lot of late. Instead, we're still keying in on the 50-day line (purple) at 2446. Unless we close under that level, we really can't get too worried. In fact, we may even trade under that level for a few days (slightly) without jump-starting a real bearish trend. Why? The small moves under the 50-day line in late December and late January didn't really cause any bearish problems.
Though we're not yet able to say things are decisively bearish or bullish, we continue to see all the moving average lines flatten out, with the 10- and 20-day lines getting pretty close to crossing under the 50-day average. That's a bearish red flag we have to take pretty seriously, as we can't just chalk it up to a few days worth of volatility. There's nothing to really conclude anything bearish out of that situation just yet, but it's definitely staying on the radar.
NASDAQ Chart - Daily

S&P 500 Commentary
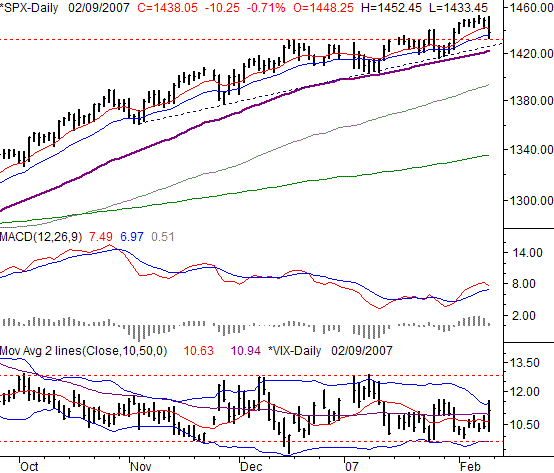
Off by 10.25 points on Friday, the S&P 500's 0.71% dip into the red left the large-cap index at 1438.05. That was essentially the lone culprit behind the weekly loss of 10.35 points. However, we still see a significant amount of bullishness on this chart.
Don't fret over Friday - we've been there dozens of times in the last few months, and none of those instances were a big problem. Instead, it just seems to be par for the course when it comes to the S&P 500 -- two steps forward, one step back. If you look closely, you'll see the SPX is still above its key support line (dashed) at 1425, as well as the 50-day moving average line (purple) at 1422. As long as either holds up as support, we're not even going to flinch. Of course, that means the S&P 500 could slide a little lower and still be in a generally bullish trend.
The potential trump card is still the VIX, and it got a little more twisted on Friday. We had been discussing the zone between 9.8 and 12.5 (dashed, on the VIX chart) as the range we were watching to mark possible reversals. However, those lines were also matched by the VIX's Bollinger bands (blue, on the VIX chart). Well, the extreme ranges changed on Friday, as the VIX intercepted the upper band at 11.50. Is that the ceiling, or is 12.50 still the line to watch. We can't say for sure, but we put a little more faith in the self-adjusting Bollinger band lines. If our preference is the right one, then the VIX just peaked, and should travel lower soon. When and if it does, the market should be pressured higher (yet one more reason why the bulls should still be satisfied).
A move above the recent high of 1453 would go far in getting other buyers on board, though we haven't seen explosive rallies stem from the move to new highs lately.
S&P 500 Chart - Daily

Dow Jones Industrial Average Commentary
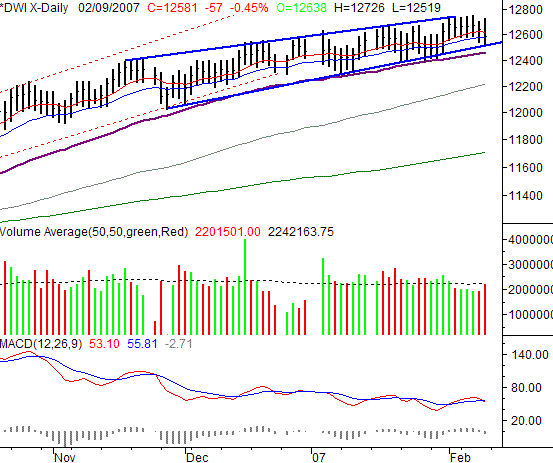
On Friday, the Dow Jones Industrial Average closed at 12,580.83, down 56.8 points (-0.45%) for the day, which meant a 72.66 point loss (-0.57%) for the week. Obviously, that's not exactly bullish, but it still leaves the Dow within a generally bullish framework. So, no need to run for the hills just yet.
Bearish, or bullish? It depends on your timeframe. Like the other two indices, we think the Dow may be facing a couple of inconsequential down sessions after hitting peaks late last week. For the Dow, that notion is highlighted by the fact that the chart is at the upper edge of its mildly-bullish 'zone' (framed by blue lines). As you can see over the last few weeks, the Dow has been bouncing around in that channel. If history holds up, we're due for more of the same.
As long as the lower edge of that range and/or the 50-day moving average line at 12,422 hold up as support, we're not going to get too concerned for the bulls. In fact, the bulls may not even have to suffer at all. The 10- and 20-day lines acted as support at the end of last week. Of course, they haven't been consistent support in months, so don't get too excited about it now. The bigger bullish picture means much more.
Dow Jones Industrial Average Chart

Price Headley is the founder and chief analyst of BigTrends.com.
|