With yesterday's high of 1220.03 for the S&P 500, the bulls and the bears are at a proverbial fork in the road. We'll look at that in detail today, but we also wanted to examine a sentiment indicator that moved to a new all-time low. To see a sentiment tool do this is particularly troubling, because they weren't really 'designed' to do this - it's sign that investor opinion is at an extreme right now, and when that happens, fireworks soon follow. And then, how long might those fireworks last? We'll wrap up with a comparison of the short-term chart and a long-term chart.
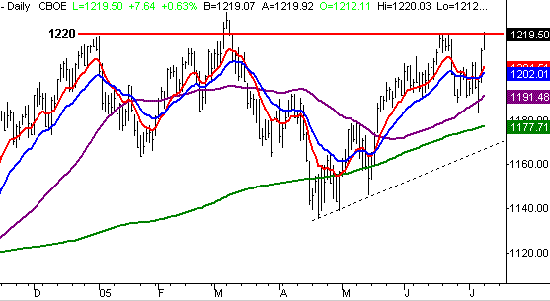
First and foremost, the S&P 500 is toying with the market right now. We plotted resistance at 1219 several days ago (horizontal red line), after topping out at that level in mid-June. This was a particularly important line, as it was pretty much the high we hit right at the beginning of the year, and just a fraction under the peak at 1229 from March. In other words, this is a meaningful line. If the index can hurdle it, the market could soar, since there wouldn't be any barrier left. On the other hand, there's clearly a lot of sellers at the 1220 level - we've seen it every time this mark has been approached this year. As of right now, the index is still under it, so technically this chart is bearish. Then again, we have to be realistic. The index could take a few days to work past this line, and we have to allow for that. In fact, aside from the fact that the resistance (so far) has held, the chart actually looks like the buyers have been in control. We recovered quickly from last week's dip to 1183.55, to resume our uptrend that began in April. And now we find ourselves at the inflection point - the S&P closed right at 1219.52. That's where the 'tense moments' came from. Keep an eye on the 1220 level on the chart below, then read on about the sentiment tool that's breaking new ground.
S&P 500 - Daily

Although the S&P is on the verge of breaking to new highs, the CBOE Volatility Index (or VIX) is to the point of being scary. If you're familiar with the VIX, you can skip the following section, and move on to the next one. If you'd like to know more about why the VIX could be a major problem, then be sure to read the next paragraph.
In a nutshell, the VIX is the ratio of the prices of a set group of call options and the prices of a certain group of put options. The Chicago Board of Option Exchange (or CBOE) monitors and publishes the VIX data on a real-time basis. For traders, the VIX is considered a fear gauge, since the ratio will fluctuate as investors move between various degrees of bullishness and bearishness as time moves on. So how does that help us? By noting when the VIX hits extreme levels, traders are able to pinpoint a likely reversal for stocks. A high VIX is associated with a lot of investor fear, which contrarians have accurately seen as bullish for stocks. Conversely, a low VIX shows a high degree of investor confidence, which often comes as market tops. The effectiveness of the VIX as a reversal indicator is visible on our chart, even in a very short timeframe.
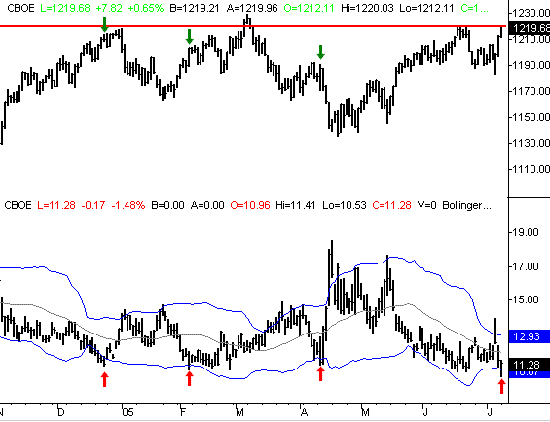
Well, the disturbing part about all of this is that the VIX hit an all-time low of 10.53 yesterday. As we mentioned above, this historically been a sign of a market top. Or in other words, the market is due for a dip. Should we heed the warning? We try and steer clear of being predictive in the TrendWatch. Our only goal is to be educational using real-world, timely examples, but we will say this....the last few times the VIX hit the lower Bollinger band, the market was indeed punished. Each of those extremely low VIX readings is marked with a red arrow, while the corresponding day for the S&P 500 is marked with a green arrow. It's unlikely that it's a mere coincidence, but you'll have to be your own judge of that.
S&P 500 versus the CBOE Volatility Index

So, if this painfully low VIX is really a problem, how much of a problem is it? That all depends on your timeframe. The last time the VIX was at the low end of its range was April 13th. The selloff that followed was only three days long, but it was a horrible three days. The February 4th signal was minor, and the S&P barely even stumbled. The October 1st and December 23rd signals were accurate, resulting in three to four weeks of pretty strong selling. So, it's never perfectly clear just how rough things might get. We just know the VIX doesn't loiter at these low readings for too long.
That said, it may take a few days for this to pan out. In fact, in almost all instances, stocks don't start to pullback until two to three days after the VIX has started to move higher. Plus, the VIX may make yet another new low today. It's the bounce higher for the VIX that typically signals the market top - not the low reading itself.
We'll just add this....even if we don't hit a top (of any duration) in the next few days, this low VIX is still a problem that will need to be resolved before the market can make any real gains. See how high the VIX was in mid-October and mid-April? We'd have to see the VIX get closer to those levels again before stocks can make a full-blown rally with any longevity. Otherwise, any bullish move would be half-hearted because bull trends just don't start with a VIX this low. But remember, a breakout above 1220 would still be a breakout - it just might not last all that long.
Price Headley is the founder and chief analyst of BigTrends.com.