| Whis Is MACD - Moving Average Convergence/Divergence? |
| By Andy Swan |
Published
02/15/2007
|
Currency , Futures , Options , Stocks
|
Unrated
|
|
|
|
Whis Is MACD - Moving Average Convergence/Divergence?
There is an oscillator technique that uses two exponential moving averages. The MACD or Moving Average Convergence/Divergence indicator was developed by Gerald Appel. The usefulness of this indicator is found in its combination of some of the oscillator principles with a dual moving average crossover approach. Although you will only see two lines plotted, three lines are actually used in its calculation. The faster line of the two is the MACD, which is the difference between two exponentially smoothed moving averages of closing prices based usually on 12 or 26 days or weeks. The slower line is called the signal line and is usually a 9 period exponentially smoothed average of the MACD line. Despite the fact that Appel supplied two sets of numbers, one for selling and one for buying, most stock traders use the default values of 12/26, and 9 in all instances, including daily and weekly values.
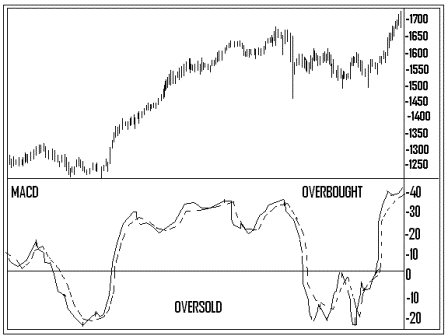
The buy and sell signals are generated when the two lines cross. When the faster MACD line crosses above the slower signal line, it’s a buy signal. Should the MACD line cross below the slower line, it is a sell signal. In this sense the MACD resembles a dual moving average method. But with the MACD values moving above and below the zero line, it is working like an oscillator. When the lines are too far above the zero line, the market is in an overbought condition. The market is oversold when the lines are too far below the zero line. The best position for buy signals are when the prices are well below the zero line. Similar to the momentum technique, buy and sell signals are generated by crossing above and below the zero line respectively.
Divergences appear between the trend of the MACD lines and the price line. When the MACD lines are well above the zero line, in the overbought condition, a negative or bearish divergence exists, which will start to weaken while prices continue to trend higher. This is often the warning of a market top. The divergence is positive or bullish when the MACD lines are well below the zero line in the oversold condition, and start to move up ahead of the price line. This often signals a market bottom. Simple trendlines can be drawn on the MACD to help point out important trend changes. See the rough graph below to get an idea of what the MACD would look like plotted on a chart. The solid line is the faster line, and the dotted, the slower.

Andy Swan is co-founder and head trader for DaytradeTeam.com. To get all of Andy's day trading, swing trading, and options trading alerts in real time, subscribe to a one-week, all-inclusive trial membership to DaytradeTeam by clicking here.
|