NASDAQ COMMENTARY
The week started off with fireworks for the NASDAQ, as the index gained 22 points on Monday after adding 37 points on Friday. Those fireworks have fizzled though, and the composite has (so far) ended its hot streak.
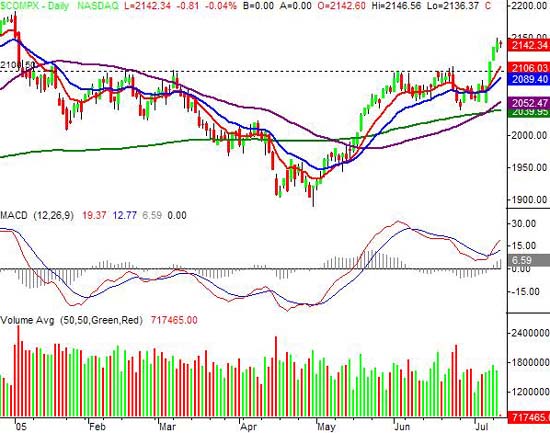
All the same, the short-lived surge was enough to carry the NASDAQ past the troubling 2100 level. We'd hit that level several times this year, so now that we're finally past it, traders can breathe a sigh of relief....even if the market does take a pause to regroup. In fact, with the composite currently at 2142, we're due for just that. The current divergence above the 10 day moving average (at 2106) is the second widest separation we've seen all year, and the market is getting a little uptight about it. The widest divergence came in May, when the composite was launched off the year low of 1889.83. Traders could stomach it then, because stocks were coming out of a deep selloff. Now the dynamic has changed - it's easy to retrace your steps; it's not as easy to break new ground. And with the composite just 49 points under the year high of 2191.60, most traders know we're at a major pivot point.
As you'll read in the S&P 500 comments below, handling this chart depends on your timeframe. The runup from last Thursday's low of 2050.30 has basically been unchecked, and although we saw it happen in May, we don't think the NASDAQ is up for a repeat of that heroic effort. The volume behind the move is starting to shrink. However, a dip all the way back down to the 10 day line could be healthy. It would verify that this rally is real (assuming we find support around 2100) and it would give most investors a second chance to get into a strong upside move. The second wave of buying should be made on the kind of growing volume we need to see to keep this move alive. But in the grand scheme of things, yes, we're bullish. After all, the 50 day line is back above the 200 day line, and all the key averages are pointed higher.
Support is at 2100, with resistance at 2192.
NASDAQ CHART

S&P 500 COMMENTARY
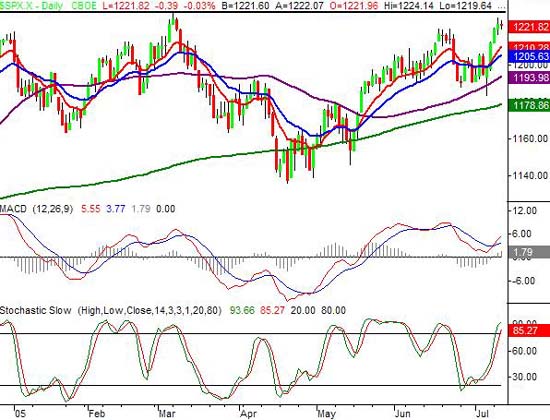
Next stop, 1229. At least that's the next likely resistance point for the SPX. In our last update, we pointed out that 1219 was a trouble spot for this large-cap index. In fact, on the 11th, it looked like we'd get stopped there again. But yesterday, the chart rallied past that line, getting as high as 1225.54 before closing at 1222.21. We're basically flat so far today, and have yet to test Tuesday's high or low.
The S&P's chart is something of a mixed bag really. The bulls have some momentum, winning 7 of the last 10 days. In fact, we saw a bullish MACD crossover made on Monday. Throw in the fact that the current bars are above all of the important moving average lines, and, well, being bullish seems to make sense.
On the flipside, the hesitation is rooted in several places. The S&P had a nice run, but the quick rally may have been more than the index can handle. We are now stochastically overbought. That's not to say that the market will pullback because of it, but there will be more profit-taking pressure now. The other, more subtle sign is visible in the day-to-day price bars - especially today's. The gains had been getting bigger, and the SPX had no problem making new highs. Today, though, the buying interest is waning.
Stuck in the middle, neither side looks too interested in taking the next step, in fear of getting run over if they're wrong. For the bulls, a break above 1229 would represent new 52-week highs, and the likely rally would force the bears (and short sellers) out of their positions (augmenting the rally). Likewise, the bears know that even a small dip wouldn't rattle the uptrend. As long as the 10 and 20 day lines hold up as support, the bulls will sustain this upside move. With the S& 500 currently at 1222, that still leaves at least 12 points worth of room for losses before any downtrend would even be considered (and even then, the 50 and 200 day lines would potentially act a support). So, a major downside correction isn't exactly a safe bet either. We'll set support and resistance at 1206 and 1229 respectively. Until one of those levels is breached, the stalemate could continue.
As for which direction the market is likely to head next, we feel we're still due for at least some sort of correction. The VIX is coming up from new lows now, which typically occurs at a top. That in itself isn't a reason to plan for a dip, but when we see it occur along with a weakening market while it's oversold, that's just a little more pressure than the buyers can handle. That said, the dip doesn't have to be major - it could be short and small, as long as the VIX works its way back into the middle of its recent range. In the bigger picture, we're still bullish, and would be buying on any significant dip.
S&P 500 CHART - DAILY

Price Headley is the founder and chief analyst of BigTrends.com.