| Gold, Housing and the Yield Curve |
| By John Mauldin |
Published
02/19/2007
|
Futures , Stocks
|
Unrated
|
|
|
|
Gold, Housing and the Yield Curve
I have often written about the high probability of a recession following an inverted yield curve (where short-term rates are higher than long-term rates), based upon research which suggests the yield curve is our most reliable indicator of future recessions. I am often asked whether a yield curve causes a recession. The (very) short answer is no. But then what is the mechanism that makes it so reliable? Is it different this time? How can we believe that the economy has a few bumps in its future when things are just so darn good? We ponder these questions in today's letter, as well as peruse the "shocking" housing data released this morning, and look at a very interesting chart on gold.
An Impressive Bull Run in Gold
One of the more frustrating things about being an analyst is to make a call and then wait for what may be a long time before the market decides to approve of your intuitive foresight ... or brutally punish your hubris. But it comes with the territory, so if you have been doing this long enough, you eventually develop some emotional calluses as well as a certain quantum of humility. Some of the more dangerous characters in this business are those who refuse to acknowledge they can be wrong and demand the market confirm their superior wisdom. A good investment or great market call is evidence of their genius, but if something negative happens, it is simply bad luck or an intransigent market. Those who ride a bull need to realize that it is easy to get thrown off. Risk controls are the mantra of the better players in the investment game.
I find the better analysts that I meet have a very refined sense of their potential for being wrong at any given time. In fact, the better they are, the more humility they seem to exhibit. They may pound the table when espousing their point of view, and argue with great and laudable vigor; but they constantly keep an open mind, looking to learn and grow with each missed call.
Thus, when you do make a call and the market decides to confirm your wisdom fairly quickly, it is an easy thing to remember. It also is a reminder that luck is a sometimes good thing. I became bearish on the dollar and thus bullish on gold in early 2002. And it has been an impressive bull run.
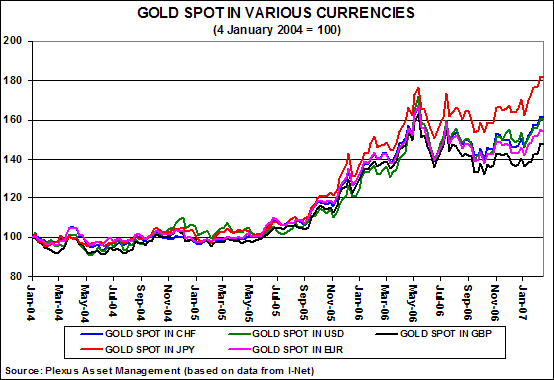
Most of my bullishness about gold has been admittedly centered in my still long-term bearish posture on the US dollar. And in the beginning of the run, that was the correct position. But of late, gold has been in a bull market across the board. My good friend and South African partner Prieur du Plessis sent me the following graph and table, following a discussion on gold. While we are familiar with the rise in gold in terms of the dollar, it is instructive to look at how it has done in other major currencies (the euro, pound, yen and Swiss franc):

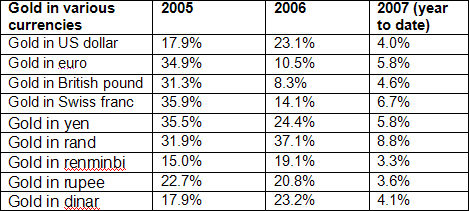
For the last three years, gold has been in a bigger bull run in terms of yen than in any other major currency, making new recent highs. And look at the following table, which shows the percentage increase for gold in terms of nine different currencies over the last two years:

Gold is at $668.50 and is having trouble busting through $670. There are persistent rumors that there is a major seller at this level. Dennis Gartman (no gold bug he, but he is currently bullish on the barbarous relic) writes this morning:
"Moving on to gold, we note that the resistance between $668-670 has proven formidable indeed, for gold has effectively traded within that range for the half day prior to writing yesterday's TGL and for the past full day. Once again, we've no idea who it is that is selling spot gold at $670, but it is someone of very real consequence and with very material selling to be accomplished. Once again, it may be a government, it may be a hedge fund, it may be miners hedging forward production because of bank agreements made on a project or two or three... it may be a combination of the above, or it may simply be very large 'specs' wishing to take profits on old long positions or wishing to get materially short.
"All we care about is that it is someone or something that has thus far successfully stopped gold from advancing, and with the week's end upon us, we shall not be at all surprised to see that seller remain successful in keeping gold from moving through his offers. Next week, however, the 'game' shall be played with a bit more enthusiasm, and the seller... whoever or whatever 'he' might be... shall have a far more difficult time keeping gold in check."
As I have said many times, gold is a neutral "currency." It is the one currency that cannot be printed by a reserve bank, and thus, is a long-term hedge against monetary deterioration. Gartman gives us a very wise quote from James Burton, Chief Executive of the Gold Council, and one with which I totally agree. When queried about whether a return to a gold standard is possible in the foreseeable future, he answered:
"No - the gold standard was appropriate to the second half of the 19th century, but circumstances are now different. But this does not mean that gold no longer has a monetary role. It remains an important reserve asset for central banks since it is the only reserve asset that is no one's liability. It is thus a defense against unknown contingencies. It is a long-term inflation hedge and also a proven dollar hedge while it has good diversification properties for a central bank's reserve asset portfolio."
I would expect to see more developing central banks put some of their reserves into gold over time, as the developed world sells some of their gold. I would also not be surprised to see another bubble in gold develop at some point, as there is something about the metal that seems to alter mental reality when it starts to run. I hope not, for a bubble and the following aftermath would do a great deal of damage.
What the Yield Curve Tells Us
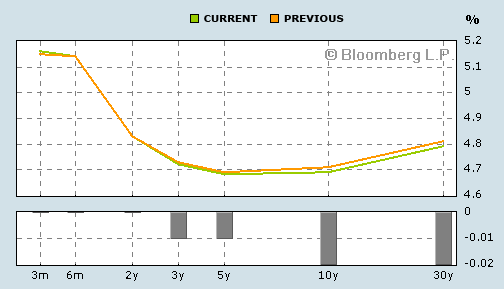
The yield curve is the slope of the line between short-term and long-term interest rates. In a normal world, you get more interest (yield) for longer-dated maturities. But sometimes (rarely) the interest-rate world gets out of sorts, and short-term rates become higher than long-term rates. The yield curve is said to be inverted, as it is today - witness the graph from Bloomberg below:

I have written at length about the various studies, first by Professor Harvey Campbell of Duke and then later by New York Federal Reserve economists Mishkin and Estrella, which show an inverted yield curve to be the best indicator of a future recession. For those not familiar with the studies, you can go to my December 30, 2005 e-letter to review: http://www.2000wave.com/article.asp?id=mwo123005
In short, the yield curve inverted significantly last fall; and if past performance is indicative of future results, the studies suggest we should see a recession as early as the late second quarter of this year, or more likely in the third quarter. Note: we have never had an inverted yield curve as we currently have without a recession following within about 4 quarters.
But a yield curve does not cause a recession. It simply tells us that something wicked this way comes. Something is out of kilter in the economy. Looking back at past recessions, it has been different things, so we can't look to history with any sense of reliability to say, "This is it!"
So, when the yield curve gets inverted we must pay special attention. As we examine the economic landscape today, what could bring about a recession or serious slowdown? The service sector certainly seems to be in good shape. Agricultural firms are getting record high prices. The financial sector, with the notable exception of mortgage firms, is seeing ever higher profits. The world seems awash with cash.
What could be the problem? As I have written for the past few months, I think the culprit is going to be the housing market. Both as a result of a slowdown in construction which will modestly increase unemployment, but more importantly as a result of a decrease in the ability of the US consumer to borrow against their home as home values go flat or fall and mortgage lenders have to tighten up the credit standards. This is going to put a constraint on consumer spending, and that is going to be enough to tip us into what I think is going to be a mild recession.
Ken Fisher writes in this weeks Forbes that we have seen the bottom on the housing market. "In the last six months housing stocks are up 24%, well ahead of the market. If housing were destined to fall apart in 2007 these stocks wouldn't be so strong now."
And maybe he's right, as the stocks are still relatively good values if they meet their 2007-8 earnings projections. But the same argument could be made about tech stocks in 1999. And the stock market was telling us in August of 2000 that the economy was getting ready to boom. The stock market does not always get it right.
That being said, the data which has been coming out for the past few months has not been kind to my predictions, but today we have new inputs which suggest that maybe we are starting to see some cracks in the economy.
GDP is AWOL
Only a few weeks ago, we were told that the GDP for the fourth quarter was 3.4%, which is rather robust. I must admit I was taken somewhat aback by that number, as it did not square with the rest of what I was seeing. But you have to be ready to admit you are wrong when you are. Only, we find the data is not as robust as first thought.
The first estimate of GDP growth is done on a basis of estimates of inventory and productivity, among other things. It turns out reducing inventories were the basis of much of the growth estimate. Reducing inventories is not the same as increased production. JP Morgan estimates GDP may have been overstated by as much as 1%, and we will see that official number revised downward in the next few months.
That "Shocking" Housing Data
This morning, while driving into the office, I was listening to CNBC. The reporter was talking about the "shocking" housing starts number, which plunged 14.3%. As it happened, I was driving in with my daughter, and turned to her and said, "There's nothing shocking about that number. It's what you would expect." Well, maybe that's not quite the case. The lowest estimates were for about 6% above what the actual number came in at (a 1.4 million starts pace, down from 1.6 million).
The number of homes under construction declined, the number of completions declined, and the number of houses authorized but not yet started declined. There is a simple explanation. Even with construction off more than 38% in the past two quarters, inventories have only fallen by about 6% from a record high in July of 573,000 homes.
Slower sales and cancellations of existing orders have caused the number of unsold homes to pile up. The supply of homes at last year's sales rate averaged 6.4 months' worth, up from 4.4 months' worth in 2005 and 4 months in 2004. And as the buying is slowing down, that inventory is rising. Sellers of previously owned homes are lowering prices to drum up demand. The median price of a previously owned, single- family home fell in 73 of 149 metropolitan areas in the fourth quarter, a National Association of Realtors report showed yesterday.
Toll Brothers Inc., the largest US luxury home builder, reported a 33 percent plunge in orders during the quarter ended Jan. 31. Ken Fisher has the company on his buy list at 19 times what he calls depressed earnings. With today's announcement it looks like earnings could get more depressed.
I think it is going to get worse as the sub-prime mortgage market starts to cough homes that were sold the last two years back onto the market because of foreclosures. Foreclosures are up five times in Denver, as an example.
Dave Seiders, chief economist at the National Association of Home Builders, predicts that the cut in residential investment (construction) will shave one percentage point from the economy's inflation-adjusted growth rate in the first quarter, more than he was anticipating late last year.
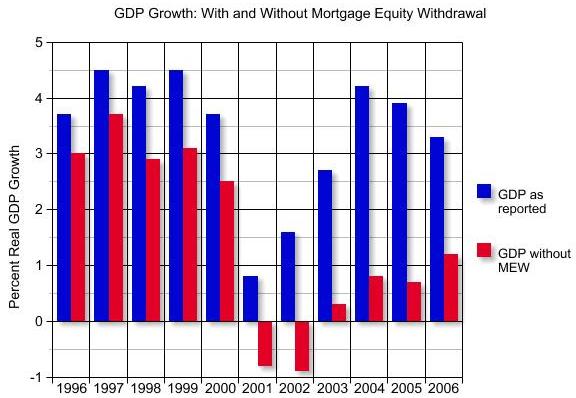
But the real hit comes from the decrease in mortgage equity withdrawal. Let's look again at the following graph. I know I have used it before, but it is at the crux of my potential recession argument.
Mortgage Equity Withdrawal (MEW) accounted for over 2% of last year's GDP growth. Take away that and 1% for construction, and we would have been close to a recession.

Now MEWs are not going to disappear. This is the US consumer we are talking about. They are committed to supporting world trade through increased borrowing. No, the problem is going to be that MEWs are going to be harder and harder to get, especially for sub-prime mortgages.
A decade ago sub-prime mortgages were a mere $35 billion. Today they are one-fourth of all mortgages, about $665 billion. Somewhere in the neighborhood of $1 trillion in adjustable-rate mortgages is eligible to be reset in the next two years, sharply increasing payments and lowering the discretionary spending ability of those homeowners.
But the real hit is going to be the inability of many to actually get loans. In the same issue of Forbes where Fisher was telling us to buy home builders and that the housing market is going to rebound, is a very interesting article about the problems of sub-prime lenders. Here are some of the high (or maybe low) lights.
Some 79% of the loans by FirstFed Financial were so-called stated income loans, in which the borrower's income did not have to proven with W-2's, tax statements, or payroll checks. The list of institutions with such problematic loan policies is long. And the result is that there are going to be a lot of new homeowners getting into financial difficulty. The Center for Responsible Lending estimates that as many as 20% of the subprime mortgages made in the last two years could go into foreclosure, or about 5% of the total homes sold. If just half of those homes come back onto the market, it will cause home prices to fall, limiting the ability of people to borrow, causing valuations to fall and a reduction in MEWs.
Compound that with probable legislation sponsored by Democratic Congressman Barney Frank and Senator Chris Dodd to tighten up lending standards and disclosure rules, and you could see loans at the lower end of the market dry up. And by the way, full disclosure requirements would be a very good thing.
The subprime mortgage market is going to be a scandal by the end of this year, as these loans have been packaged and sold as investment-grade bonds by numerous investment banks, mostly to European and Asian institutions. Some of these Collateralized Debt Obligations, or CDOs, are going to default and there is going to be a major wave of lawsuits.
So, will there be a recession? I still think so, and I think the culprit is going to be the housing market, which is going to trigger a slowdown in consumer spending, the first such slowdown since 1991. If Fisher is right and the housing market is getting ready to take off, then I am going to be not just wrong, but really wrong. We'll see.
John Mauldin is president of Millennium Wave Advisors, LLC, a registered investment advisor. Contact John at John@FrontlineThoughts.com.
Disclaimer
John Mauldin is president of Millennium Wave Advisors, LLC, a registered investment advisor. All material presented herein is believed to be reliable but we cannot attest to its accuracy. Investment recommendations may change and readers are urged to check with their investment counselors before making any investment decisions.
|
|