| The McMillan Options Strategist Weekly |
| By Lawrence G. McMillan |
Published
02/23/2007
|
Options
|
Unrated
|
|
|
|
The McMillan Options Strategist Weekly
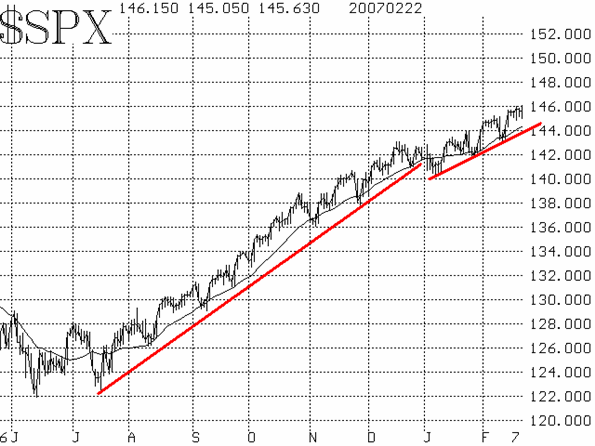
An entire week has passed since $SPX last broke out strongly on the upside to new 6-year highs. Since then, very little movement has taken place. $SPX is up a measly 1.08 points since then, and its closing range has been a minuscule 4 points over the five-day period. Once again, traders are barraged with the "cup half full" (bullish) theories that the market is working off its overbought condition by going sideways, versus the "cup half empty" (bearish) scenario that the market is living on borrowed time because it hasn't been able to follow through on the upside. We noted similar comments a few weeks ago, and that short-term situation was resolved with a sharp downward move (followed by new highs). We are looking for similar action again.
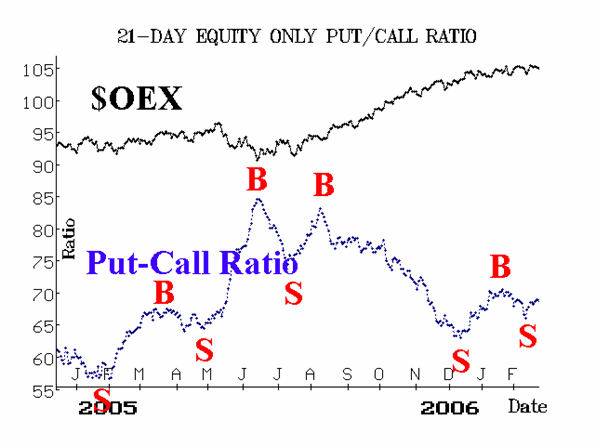
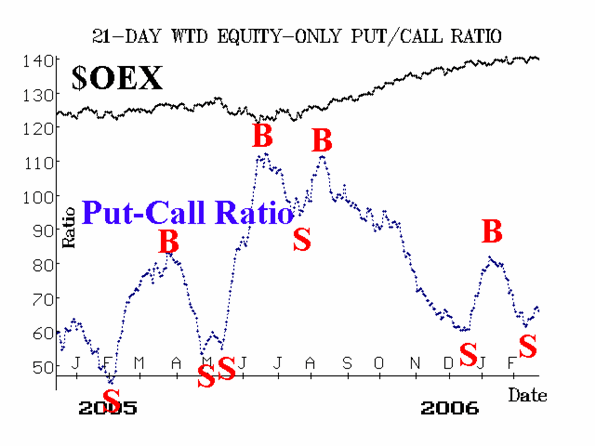
The reason that we have a negative bias at this point is based on our technical indicators. First, the equity-only put-call ratios are negative. Despite recent new highs in $SPX and the tight range described above, both of these intermediate-term ratios have remained on sell signals throughout this period.

Second, market breadth has remained overbought while $SPX has been in this tight range. By itself, that is not bearish, since we know that the market can rally while overbought conditions exist. However, the fact that breadth indicators have remained overbought contradicts the bulls' contention that the sideways action is alleviating an overbought condition. It hasn't, in fact. More likely, one could conclude that the market is burning up a lot of energy (producing a lot of daily advancing issues) without going anywhere. That type of action often leads to a selloff when the buyers finally take a breather.

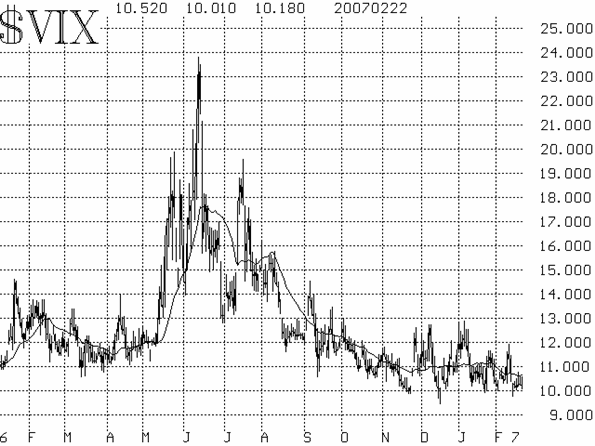
Third, the volatility indices remain in "sell" status, as $VXO closed below 10 for six days in a row, and $VIX closed below 10.30 for six days as well. Low $VIX readings are somewhat like high breadth readings -- they indicate the market is overbought. However, when $VIX is this low, it's usually a sign that $VIX is more than overbought. Rather, it's a sell signal.


In summary, we expect the market to have a sharp, but short-lived, correction to actually alleviate the overbought conditions that continueto persist. After that, we expect higher prices. Hence, we are not currently calling for a major top in the market, but we do feel that it certainly needs a minor shakeout before significantly higher prices are possible.
Lawrence G. McMillan is the author of two best selling books on options, including Options as a Strategic Investment, recognized as essential resources for any serious option trader's library.
|