| Corcoran Technical Trading Patterns for February 23 |
| By Clive Corcoran |
Published
02/23/2007
|
Stocks
|
Unrated
|
|
|
|
Corcoran Technical Trading Patterns for February 23
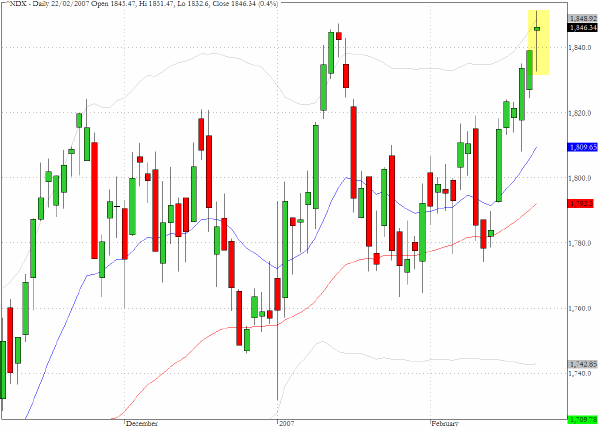
Several of the broad equity indices closed at all time highs yesterday including the Russell 2000 and the S&P Midcap index. The Nasdaq 100 (^NDX) closed at a new multi year high as it inched just ahead of the January 12 close. The chart pattern for yesterday, a Doji/hanging man candlestick at what could be a double top has sometimes been construed as indicating a possible turning point.
There have been some divergences lately that are suggesting some grounds for concern about a near term correction and we will be watching today to see whether there is follow through on the semiconductor strength that was seen yesterday.
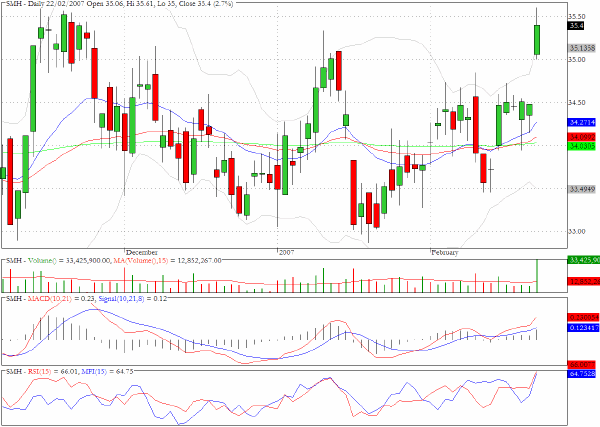
One of the developments yesterday that could have a large impact on the near term direction of the markets was the strong performance from many of the semiconductor stocks. ADI was up by more than 10%, NSM rose by 7.3%, and LLTC was up almost 10%. We have featured the chart for the ETF that tracks the semiconductor sector, SMH. Yesterday's close brought it very close to the top of the trading range which has been in place since September. If the constructive price action continues and the range is broken then the large Nasdaq stocks may have found the impetus they need to break away convincingly from the range that has contained them recently.
TRADE OPPORTUNITIES/SETUPS FOR FRIDAY FEBRUARY 23, 2007
The patterns identified below should be considered as indicative of eventual price direction in forthcoming trading sessions. None of these setups should be seen as specifically opportune for the current trading session.
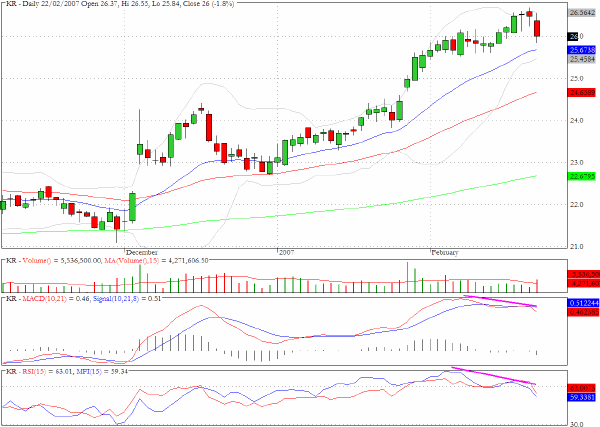
Several of the retailing stocks are showing some signs of topping behavior. Kohl's (KSS) which we mentioned yesterday sold off intraday yesterday but found some support. The chart for Kroger (KR) shows similar patterns to KSS and we will also be watching ANF today.
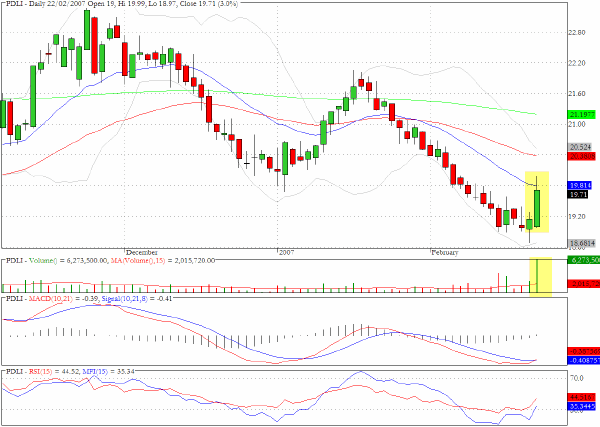
Protein Design Labs (PDLI) moved up on three times the average daily volume.
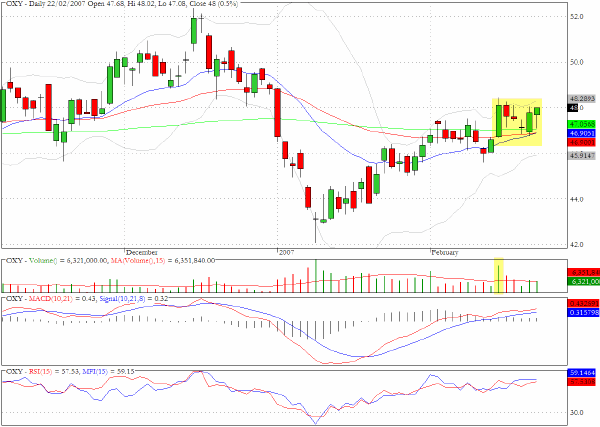
The chart for Occidental Petroleum (OXY) shows that there is a miniature flag like formation in conjunction with a convergence of all three moving averages.
Clive Corcoran is the publisher of TradeWithForm.com, which provides daily analysis and commentary on the US stock market. He specializes in market neutral investing and and is currently working on a book about the benefits of trading with long/short strategies, which is scheduled for publication later this year.
Disclaimer
The purpose of this article is to offer you the chance to review the trading methodology, risk reduction strategies and portfolio construction techniques described at tradewithform.com. There is no guarantee that the trading strategies advocated will be profitable. Moreover, there is a risk that following these strategies will lead to loss of capital. Past results are no guarante of future results. Trading stocks and CFD's can yield large rewards, but also has large potential risks. Trading with leverage can be especially risky. You should be fully aware of the risks of trading in the capital markets. You are strongly advised not to trade with capital.
|