| Corcoran Technical Trading Patterns for February 26 |
| By Clive Corcoran |
Published
02/26/2007
|
Stocks
|
Unrated
|
|
|
|
Corcoran Technical Trading Patterns for February 26
From just looking at the net changes on the day for the equity indices, it would appear that Friday's session was fairly uneventful. Both of the S&P 500 (^SPC) and the Nasdaq Composite (^IXIC) retreated by 0.4% and a similar pattern was to be seen amongst other broad indices. However, there were some rumblings in the financial sector as the problems within the sub-prime mortgage market are beginning to have a negative impact on some money center banks and the broker/dealer sector.
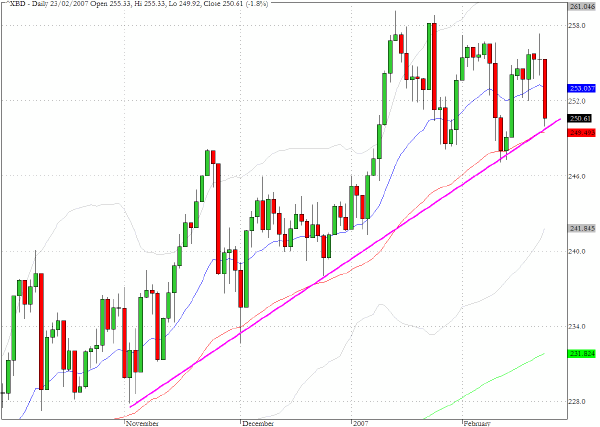
The broker/dealer index (^XBD), which we like to monitor as one important gauge to the underlying conditions in the market, took a 1.8% tumble on the session and has now reached an important level coinciding with the 50-day EMA and the trendline through the recent lows. There may have been some casualties within the hedge funds that have been buying securitized sub prime mortgages and the troubles in that section of the market have even caused problems for more traditional banks such as HSBC which axed its two top US-based executives for their bad timing in taking on exposure to the sub-prime sector.
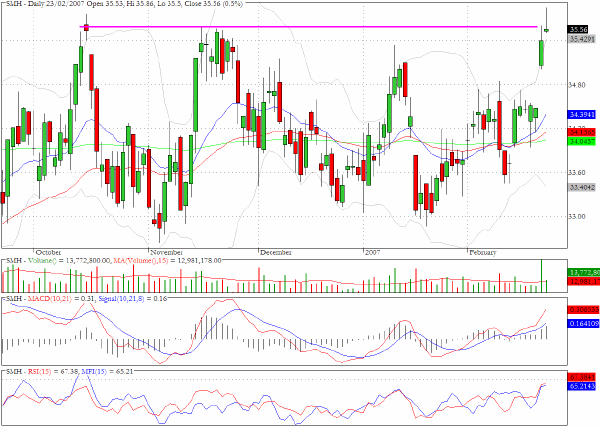
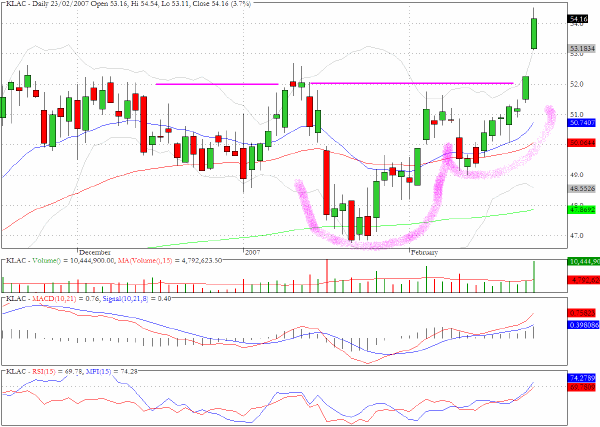
On Friday, we commented on the bullish action in the semiconductor sector from Thursday's trading and as the chart for SMH, the exchange traded sector fund, shows attention this week will be focused on whether the sector can take out the overhead resistance which has been in place since last October. As we note below, one of the stocks in the sector KLAC has a difficult hurdle to cross just above Friday's close.
The oil sector index (^XOI) has risen to a level of chart resistance but the price pattern has echoes of the cup and handle formation which can be a precursor to higher prices ahead.

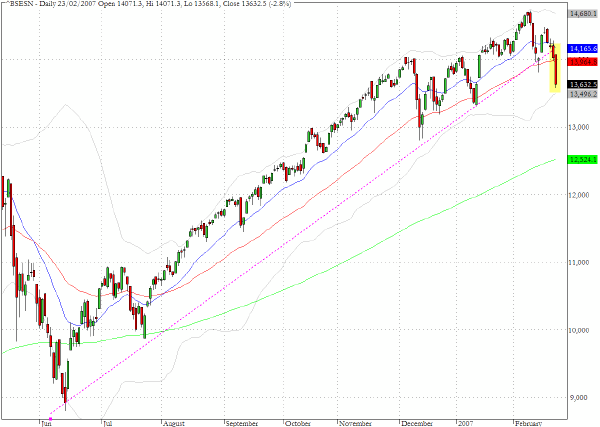
The daily chart for the Bombay Sensex index (^BSESN) provides a long term perspective on one of the markets that we like to use as an overall barometer of speculative sentiment. In May 2006 when the markets underwent a fairly swift and severe correction that rattled a few hedge funds the Sensex index was one of the first to show the strains. The action on Friday brings the index below the long standing trendline through the lows from last June which followed that last correction.
We will be watching the index this week to see just how much fall out may have been created from the difficulties within the hedge funds that have large exposure to the US mortgage market.
TRADE OPPORTUNITIES/SETUPS FOR MONDAY FEBRUARY 26, 2007
The patterns identified below should be considered as indicative of eventual price direction in forthcoming trading sessions. None of these setups should be seen as specifically opportune for the current trading session.
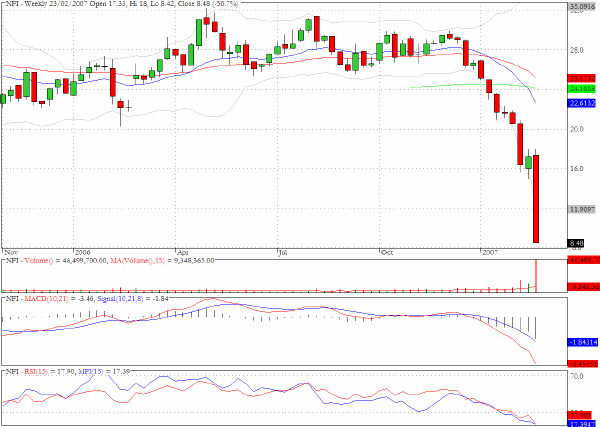
The weekly chart for Novastar Financial (NFI) provides a striking perspective on the freefall action in the sub-prime mortgage market. As can be seen the problems began in the latter part of December 2006 and the decline has accelerated producing a 50% decline in the last week alone.
Other casualties in the sector include New Century Financial (NEW) which dropped by 20% last week and Impac Mortgage (IMH) which dropped by more than ten percent over the course of last week.
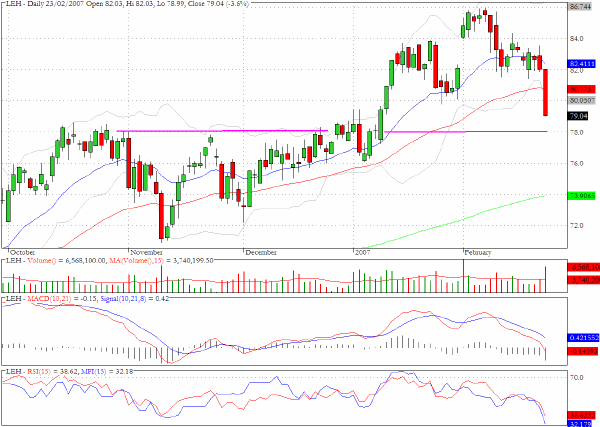
The chart for Lehman Brothers (LEH) further illustrates the market's concerns about how the woes of the sub-prime lenders may impact on the financial sector and specifically the investment banks. LEH is approaching an area of probable chart support but if that fails then we would become more concerned about the well-being of the sector.
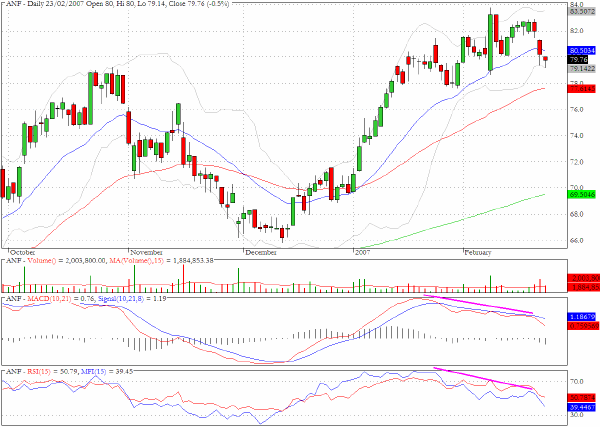
The daily chart for Abercrombie and Fitch (ANF) shows some quite notable negative divergences.
In last Wednesday's commentary we commented on the cup and handle formation for KLA-Tencor (KLAC). The uptick in the semiconductor sector has propelled KLAC above the short term $52 hurdle but the stock now faces a more long term hurdle at $54.
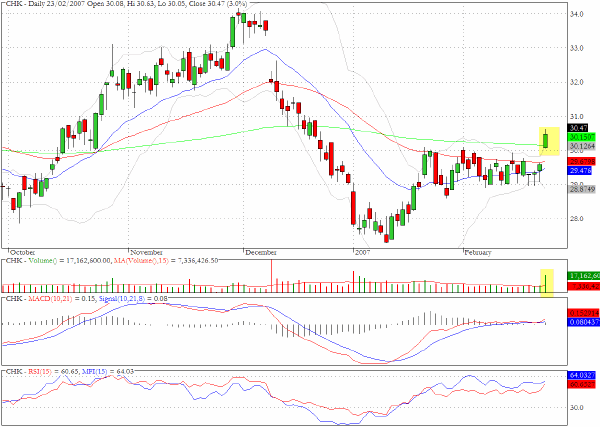
Chesapeake (CHK) produced the breakout that we alluded to in last Friday's commentary.
Clive Corcoran is the publisher of TradeWithForm.com, which provides daily analysis and commentary on the US stock market. He specializes in market neutral investing and and is currently working on a book about the benefits of trading with long/short strategies, which is scheduled for publication later this year.
Disclaimer
The purpose of this article is to offer you the chance to review the trading methodology, risk reduction strategies and portfolio construction techniques described at tradewithform.com. There is no guarantee that the trading strategies advocated will be profitable. Moreover, there is a risk that following these strategies will lead to loss of capital. Past results are no guarante of future results. Trading stocks and CFD's can yield large rewards, but also has large potential risks. Trading with leverage can be especially risky. You should be fully aware of the risks of trading in the capital markets. You are strongly advised not to trade with capital.
|