|
Weekly Outlook in the Stock Market
NASDAQ Commentary
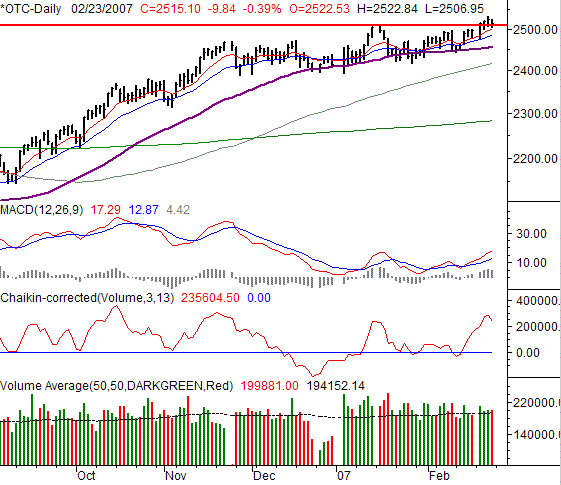
Friday's 0.39% loss for the NASDAQ Composite left it at 2515.10 for the week -- 9.84 points lower that day, though it was still up by 0.75% for the week (+18.79 points). The composite was the only index to actually stay in the black last week, which has "bigger picture" bullish implications especially now that the NASDAQ has managed to finally hit new multi-year highs after taking a month off.
We'll go ahead and warn you now that our NASDAQ view sounds a little different than our take on the S&P 500 or the Dow. We'll look at both angles, as clearly the market can't be bullish or bearish at the same time (for any length of time anyway). We just want to point out the most important thing we see on all the major charts.
Thursday's high of 2531.42 was a new annual high, and relieves a lot of concern that the NASDAQ wouldn't be able to complete the feat. Now that it has - and done a decent job at holding onto those gains - the bulls have a very justified reason to think optimistically. The index seems like it's broken out of its rut, and is working on restarting its prior bullish move.
For the NASDAQ, we think the key is the 10- and 20-day lines (red and blue, respectively). As long as they hold up as support, then we have to think this renewed bullishness can persist. No upside target though, and no bearish line in the sand if the NASDAQ is just giving us a fakeout. We'll use the other two indices (below) to determine if stocks are likely to get into some real bearish trouble.
NASDAQ Chart - Daily

S&P 500 Commentary
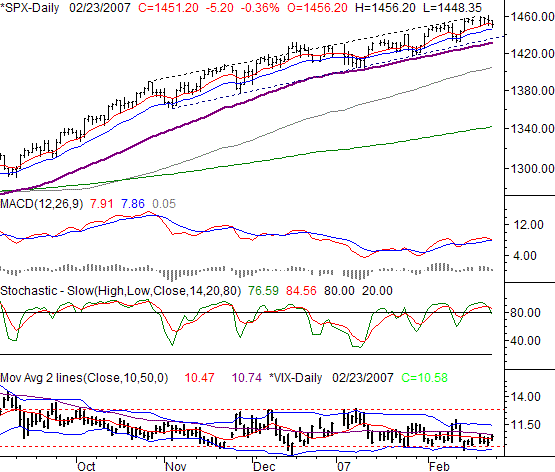
The S&P 500 pulled back by 5.20 points on Friday, closing lower by 0.36%, ending the sessions at 1451.20. On a weekly basis, the large cap index suffered a 4.35 point loss, ending Friday 0.3% under the prior week's close. Where we last left off, we seem like we're on track for just a little more downside, if the recent pattern repeats itself. Not a big deal though.
According to the alignment of all the stars, the S&P 500 is set to pull back. The problem is, the stars have aligned like this several times in the last few weeks, and the worst that has ever come of it is about a 25 point dip.
Where'd that 25 point estimate come from? The SPX's recent range, framed by the dashed lines. It's a lot of ebb and flow, but each downward ebb has been met with a little more flow in return. So, to see the index fall for most of last week - at the same time the MACD lines and stochastic lines turned bearish - doesn't really mean a lot this time around.
The line in the sand is still the lower dashed line, and then the 50-day moving average (purple) at 1431. (You'll see we have a similar view of the Dow's chart below.)
In the meantime, we do indeed expect to see a little weakness. The S&P has rolled over, and could slip all the way back to those support levels around 1434. The fact that the VIX seems to be pushing off of an important support area around 9.8 lends itself to the same idea.
However, if the VIX manages to break above 12.5 at the same time the SPX's support lines fail to hold the index up, then the index is likely to be in some serious trouble. Unless we see that though, we suspect any dip will be mild, and countered.
S&P 500 Chart - Daily

Dow Jones Industrial Average Commentary
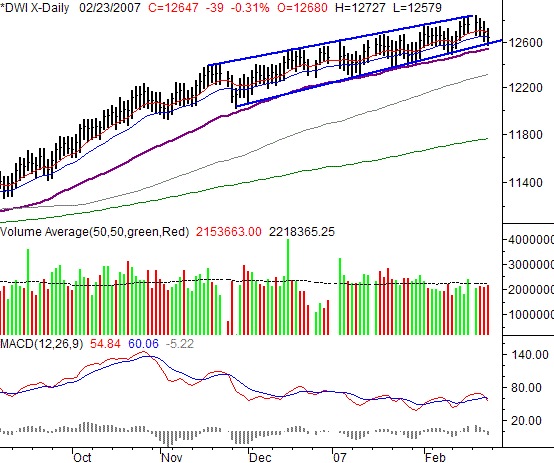
After losing 39 points on Friday (-0.31%), the Dow closed at 12,647. That was a 0.95% loss for the week (-121 points) -- the worst showing for all the indices. Not only was the Dow the biggest loser, but its chart is also the closest to the start of some serious technical trouble.
It's no news that the market has been in mildly bullish and very narrow range since late last year. On our chart of the Dow, that zone is framed in blue lines. As of Friday, the daily low of 12,579 brushed that lower edge of the zone. So far we have no reason to think it won't be support, as it has been the last three major (relatively) dips. But, the very fact that it's being tested at all isn't exactly a screaming 'buy' signal. If we continue to fall, it will be clear by Tuesday or so whether or not the intermediate-term trend is likely to be broken in a bearish way.
In the same light, the 50-day line (purple, currently at 12,540) may also be under attack as support. It flattened a bit in November, reflective of the slowdown in the overall upward momentum, yet it's managed to keep the index afloat recently. If that line fails as well, then we would strongly recommend rethinking your bullish/bearish posture. It would be the first time we've been under the 50-day line since late July, when this rally really started.
We've also added a MACD chart today, simply to illustrate how the indicator isn't infallible. It's been mixed for weeks, though the Dow has managed to mostly work its way higher.
Alternative possibility --could the NASDAQ's strength and the SPX's and Dow's weakness be rotation out of the large cap and blue chip names and into the more aggressive and smaller stocks that trade on the NASDAQ exchange? If so, the conflicting dynamics actually could be bullish. That may become more apparent this coming week, if it is indeed the case.
Dow Jones Industrial Average Chart - Daily

Price Headley is the founder and chief analyst of BigTrends.com.
|