| Corcoran Technical Trading Patterns for February 27 |
| By Clive Corcoran |
Published
02/27/2007
|
Stocks
|
Unrated
|
|
|
|
Corcoran Technical Trading Patterns for February 27
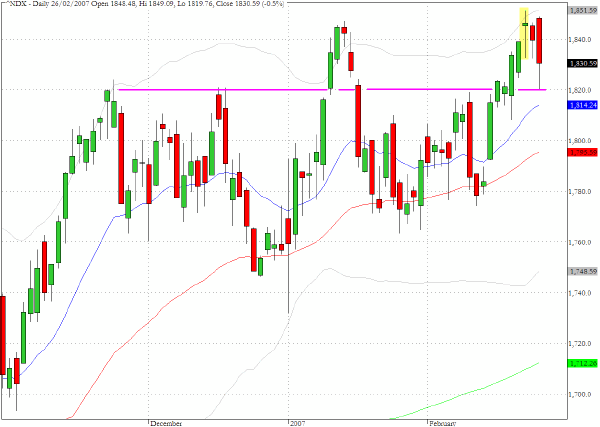
The chart for the Nasdaq 100 (^NDX) highlights the cross currents in the market. For many weeks, the 1820 level had proven to be formidable resistance for the index and yesterday's trading resistance turned into support as the index bounced off this level almost precisely. This is bullish behavior and suggests that the path of least resistance is for the index to resume its upward trajectory.
However, as we discuss below, there are other currents in the market that are pointing towards the need to be cautious and possibly adopt a defensive posture. As we are finishing preparation for this commentary, the Shanghai market has recorded a nine percent drop, its largest one day correction in ten years and the UK's FTSE 100 index is down by more than 80 points, a 1.3% correction. We would expect the US markets to be under pressure at the open on Tuesday.
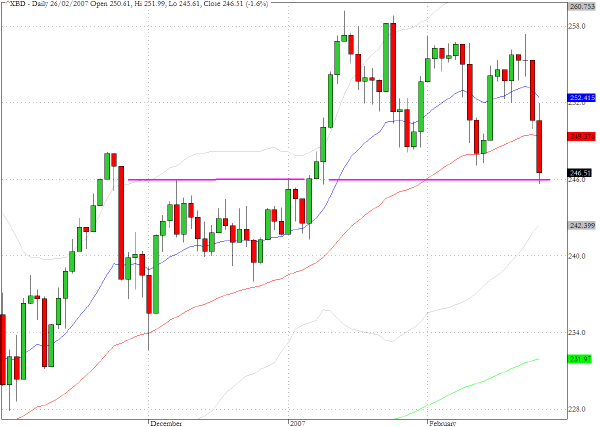
The lingering question -- how distressed is the elephant (the multi-trillion dollar credit derivatives market) in the room -- continues to haunt the investment banks and even some of the money center banks. Our weekend commentary drew attention to the pivotal pattern on the broker/dealer index (^XBD) and the jury is still out on whether the worst has been seen or whether there is more distress than the bulls would have us believe. The action in the Treasury market and utilities sector suggests that a lot of defensive allocation is taking place amongst some institutions.
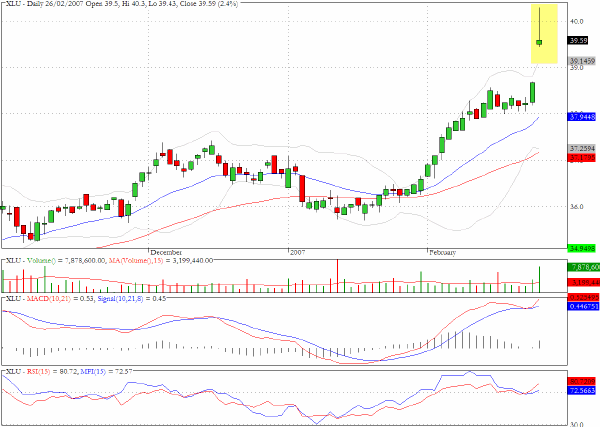
The Dow Jones Utilities index (^DJU) surged to an all time high yesterday and at one point crossed the 500 level. As suggested part of the explanation for this extraordinary behavior may be ultra defensive positioning which could be problematic for the overall market. If the problems with the sub-prime mortgage lenders have been overstated then the shooting star formation on the exchange traded sector fund, XLU, could be a reliable signal that the sector is ready for a counter trend reaction.
TRADE OPPORTUNITIES/SETUPS FOR TUESDAY FEBRUARY 27, 2007
The patterns identified below should be considered as indicative of eventual price direction in forthcoming trading sessions. None of these setups should be seen as specifically opportune for the current trading session.
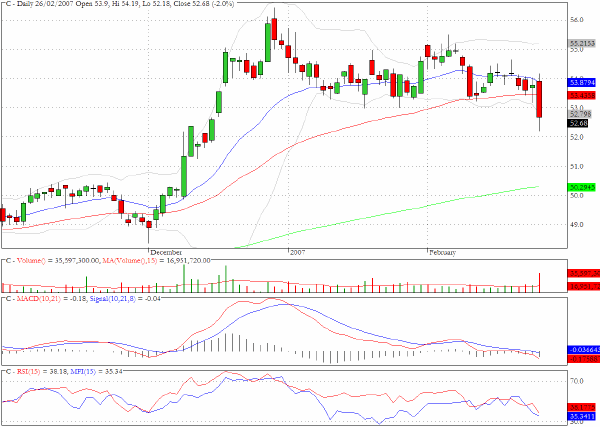
Citigroup (C) dropped below both the 20- and 50-day EMA's on heavy volume yesterday.
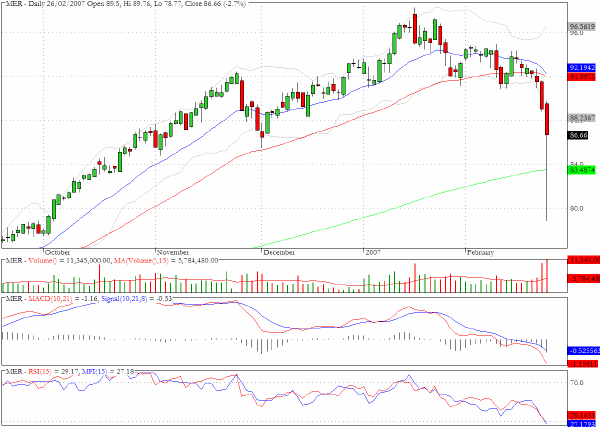
Merrill Lynch (MER) spiked down yesterday illustrating the nervousness within the brokers and investment banks.
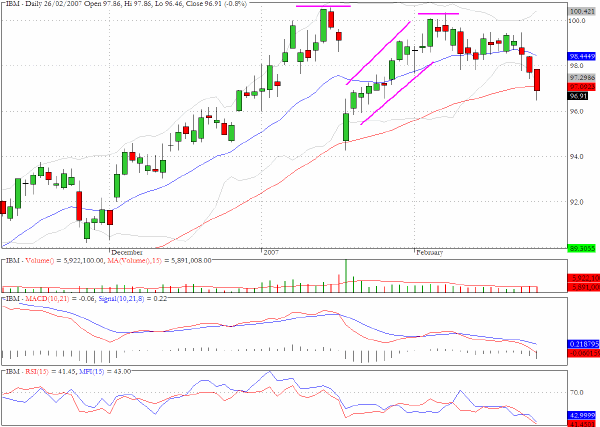
Sometimes patterns can take a while to develop the way that one would expect. One week ago we stated that "IBM has been on our watch list for the last two weeks as we expect another pullback. We still feel that the $100 price level could prove hard to penetrate." The price attrition has been unspectacular but there is strong evidence that a lower high is now in place for the intermediate term.
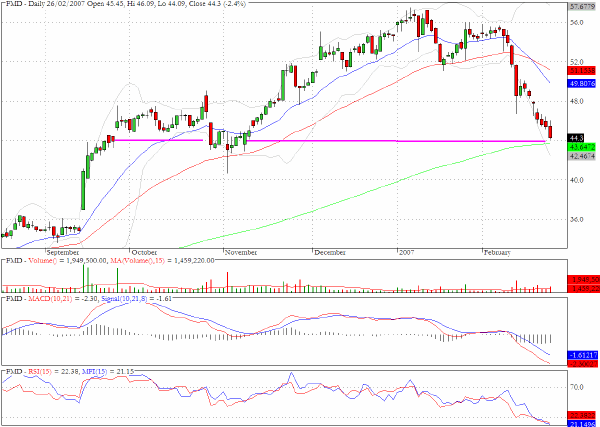
First Marblehead (FMD) has been selling off steadily but has now approached a chart level coinciding with the 200-day EMA where support might arrest the decline.
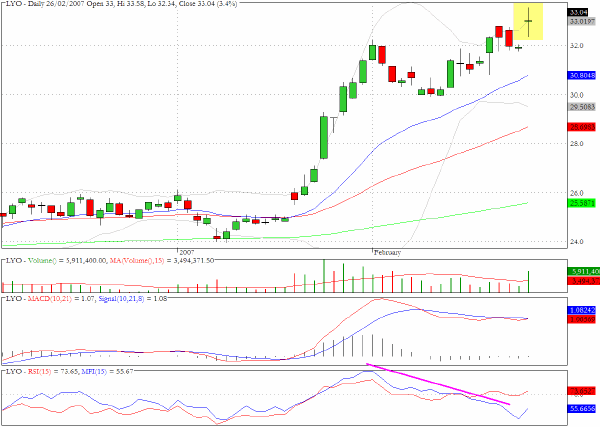
Lyondell Chemicals (LYO) produced a striking Doji/shooting star formation that is also underlined by the notable negative divergences.
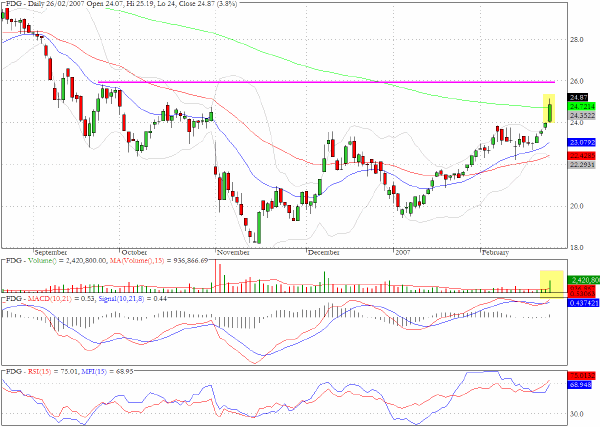
Fording (FDG) is behaving bullishly but faces a significant hurdle just above yesterday's close.
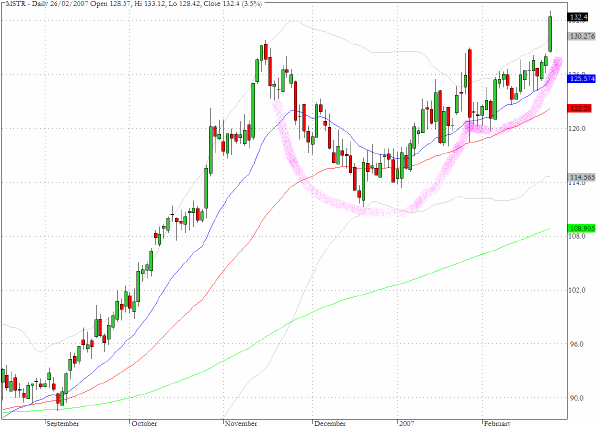
Recently we have dusted off the cup and handle template that was popularized by William O Neill as it has shown up on several bullish charts that we have profited from. In yesterday's trading the formation was again validated for Microstrategy (MSTR).
Clive Corcoran is the publisher of TradeWithForm.com, which provides daily analysis and commentary on the US stock market. He specializes in market neutral investing and and is currently working on a book about the benefits of trading with long/short strategies, which is scheduled for publication later this year.
Disclaimer
The purpose of this article is to offer you the chance to review the trading methodology, risk reduction strategies and portfolio construction techniques described at tradewithform.com. There is no guarantee that the trading strategies advocated will be profitable. Moreover, there is a risk that following these strategies will lead to loss of capital. Past results are no guarante of future results. Trading stocks and CFD's can yield large rewards, but also has large potential risks. Trading with leverage can be especially risky. You should be fully aware of the risks of trading in the capital markets. You are strongly advised not to trade with capital.
|