NASDAQ COMMENTARY
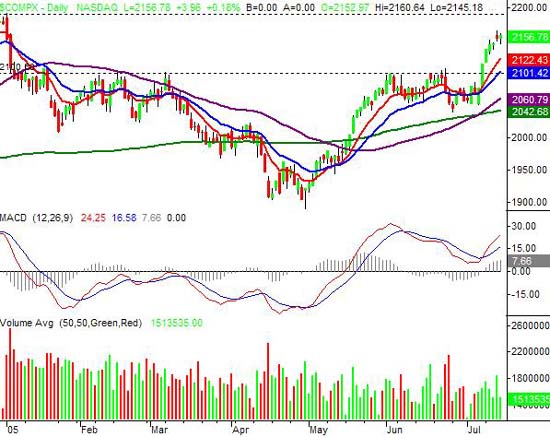
Expiration week proved to be pretty bullish. The NASDAQ continued to make higher highs after breaking past 2100 last week, to close at 2156.78 on Friday. And the composite had actually reached 2164.18 on Thursday, in the push towards new 52-week highs. That high mark rests at 2191.60, where the NASDAQ peaked on January 3rd. For the week, the index gained 43.9 points, or 2.0 percent.
So the question is, can we expect the composite to keep on trucking, or will we see things just keep waffling? More than anything else, we're bullish, but with a caveat. The upside momentum is strong for sure, but the weight of the recent gains are starting to make things a little frothy.....a little too frothy to keep the buyers confident. In fact, the pace of gains clearly slowed as last week progressed. For instance, on Friday, we made a lower low and a lower high for the first time since the previous Thursday - the day of the London bombing.
So here's the outlook - we're looking for the NASDAQ to pullback enough to cool things off just slightly. The bigger trend should stay intact though; we just see an unusual amount of confidence right now that needs to be contained. Realistically, that dip is likely to reconfirm the support at the 10 and/or 20 day moving average, at 2122 and 2101 respectively. The 20 day line near the psychologically-important 2100 line is particularly important. That leaves room for a 56 point dip, but it might be the medicine we need. Once we get there and see evidence of a recovery, we'll start setting targets for the next bullish leg.
The other possibility is that we'll continue on to higher highs without a retest. This proposition is, quite frankly, a bit scarier, because that means the bubble will be just that much bigger. If that occurs, keep in mind that there's resistance at 2191.60, which is another possible trigger point for a pullback. If we do happen to blow past that point, then the NASDAQ could go ballistic. It would be a totally unmerited rally, but that's the power of greed and euphoria. We'll look at that if we get there.
In the meantime, don't fear any mild selloff, unless we break under 2100. And even then, the 50 day line could provide support around 2060. That would probably be the worst of any downside move. Take a look at the daily chart, then read on for a quick look at the longer term (weekly chart). You'll see why we think this bigger trend has some real potential.
NASDAQ CHART

NASDAQ COMMENTARY - LONG TERM
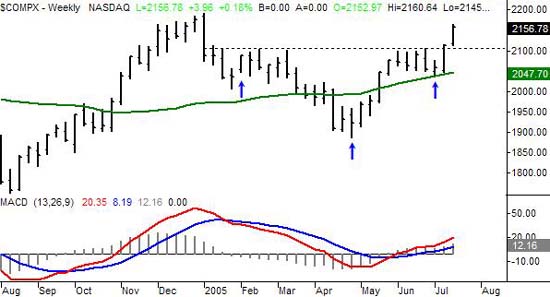
Just a quick note here. Could the NASDAQ be making an upside down head-and-shoulders pattern? The two shoulders and head are marked with blue arrows, and technically speaking, the neckline (dashed) has already been broken. None of these known patterns works 100 percent of the time, but this is actually a pretty clean example of this popular setup. Seeing this chart shape alone wouldn't be enough to merit bullishness, but to see it occur with a couple of other key bullish signs adds to the bullish potential.. Those other two signs are (1) support at the 200 day line, and (2) a break past the resistance at 2100. Just something to think about, although our use of a weekly chart means we won't really know for several days.
NASDAQ CHART - WEEKLY

S&P 500 COMMENTARY
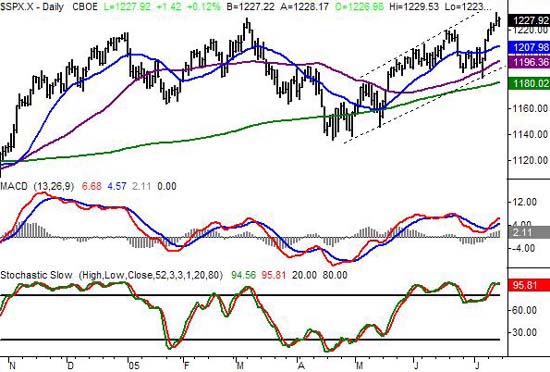
Not only did the S&P 500 hit a new 52-week high of 1233.16 last week, it's actually almost a new four-year high. The SPX rallied 16 points last week (or 1.3 percent) to close at 1227.92. It's clear now that the index is making a pattern of higher highs and higher lows. So while things are probably going to remain choppy, the net movement is going to be upside movement.
Those interim movements, though, should be big enough to trade. The most recent resistance line is around 1245, although we doubt we'll verify that line in the ultra-near future. Support is at 1190, but look for support at the 20 day line (or 1208) as well. Or in simpler terms, keep your eye on that trading zone framed with the dashed lines. It's only loose support and resistance though, so don't be stunned if one or the other isn't perfect.
As for what's next here, we're looking for a dip here too. We're stochastically overbought, and the market has cooled considerably as each day passed. Plus, the VIX is at scary lows. A lot of that may have had to do with expiration, but it happened all the same. As long as the 50 day line at 1196 holds (and it will be at or above the important 1200 level by the time it matters), the bull trend will stay alive.
S&P 500 CHART

DOW JONES INDUSTRIAL AVERAGE COMMENTARY
There's only a couple of things we want to point out about the Dow Jones average.
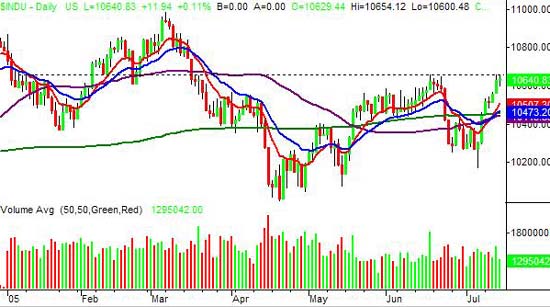
First and foremost, it looks like there's some resistance around 10,655. That's where the Dow was capped on Friday as well as in June (see the dashed line). And second, the Dow's the only major index nowhere near its March high. That's typical though, as the Dow has really lagged all year.
That in itself, however, has a certain bullish quality. The NASDAQ usually leads trends, both up and down. In fact, our primary bull/bear indicator is a measure of the NASDAQ's relative strength against the S&P 500's. Clearly the NASDAQ has assumed a leadership role over the last few weeks, in relation to the Dow anyway. The premise is that investors are willing to speculate a little bit with the NASDAQ-listed stocks, and aren't looking for the safety of the more seasoned companies you'll find in the large-cap indexes. That won't prevent a marketwide correction, but it is a hint as to what investors are thinking right now - they really are pretty confident, which is what we need for this uptrend to last.
Second, we just want to highlight all the congestion of the Dow's moving averages. They're all between 10,446 and 10,507. Any pullback here will surely find support somewhere in all that mess. And if not, a couple of closes under that range could set up a rather big dip. That however, is the less likely scenario.
DOW JONES INDUSTRIAL AVERAGE CHART

BOTTOM LINE
Expiration may have kept things contained last week, but that won't be the case this coming week. We really are due for a pullback; if and when we get, just keep it all in perspective. We think it will be a buying opportunity for longer-term holdings. It may also be big enough to make a quick bearish trade with, but it's going to be tough to time.
Price Headley is the founder and chief analyst of BigTrends.com.