| Sector Spotlight: Nowhere to Hide |
| By Price Headley |
Published
02/27/2007
|
Stocks
|
Unrated
|
|
|
|
Sector Spotlight: Nowhere to Hide
We know it's no secret to say this, but stocks got trashed today -- across the board. Materials, telecom, and the basic industrials led the charge lower, while healthcare, staples, and utilities suffered the least, though they still suffered significantly.
In light of all of the turmoil, we're not going to look at a specific sector or chart today. Rather, let's just take a look at some of the sector-based high points. With all of them seemingly underwater not just after today but now for the last five days, there really may be nowhere to hide.
Just for the record, there is one notable exception to Tuesday's carnage - the gas utilities were up, barely. But still, we have to like/respect anything that can hold off an attack like today's selling. At the very least, we want to look at the chart and see if there's more to the story.
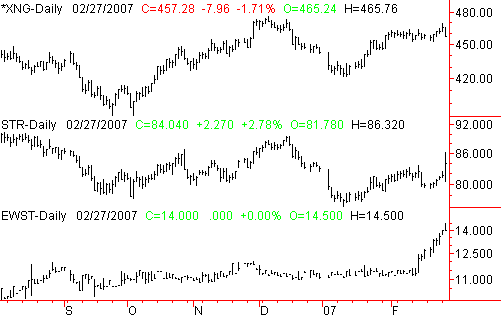
In all fairness, even the strength here was isolated, but at least it wasn't just one company. Questar (STR) was up big, and so was Energy West (EWST). The problem is, though we're impressed, the strength may have been a little too artificial (and by artificial, we actually mean temporary). Questar was up on news, and Energy West was just up on no news today (though it was riding some momentum put into place a few days ago). So, though we applaud the effort, wee don't necessarily think this one decent day makes for an overly compelling idea to get involved with just because nothing else did well. The chart of both stocks as well as the AMEX Natural Gas Index (XNG) below doesn't really inspire, so we'll keep looking. (Note that the AMEX Index isn't necessarily the same SIC code-based index we're making our comparisons to. That's why the index is down for the day while we said the industry was collectively higher.)
AMEX Natural Gas Index, Questar (STR), Energy West (EWST)

Incredibly, we found nothing else up (significantly or otherwise) on Tuesday. So, if you're looking for a trade-worthy idea, odds are it's going to need to be a bearish one.
However, we do feel the need to highlight a couple of bullish survivor themes.
Honorable Mentions
Though not exactly in the black today, there is one industry that doesn't exactly deserve to be thrown out the window with everything else.
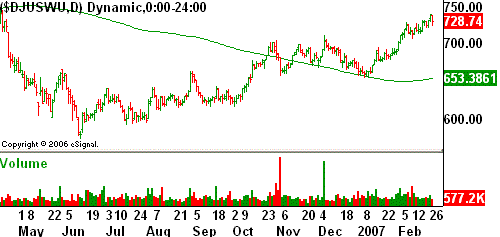
Water Utilities - We're feeling even more confident in this call we made about three weeks ago. We're up by about 2.1% since then. Though it's not gangbusters, all things considered, it's a heck of a lot better than you would have done with a simple index fund.
Dow Jones Water Utility Index - Daily

The Worst of the Worst
All that being said, here are a couple of bearish things were going to be watching not so much from a downward momentum point of view - rather, from vulnerability point of view.
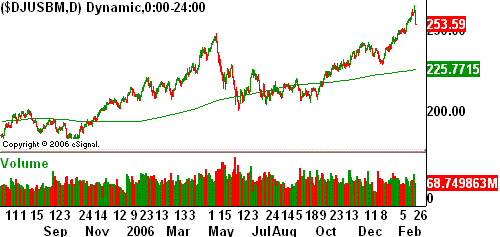
Basic Materials - Today is the biggest single-day loss we've seen in years for the Dow Jones Basic Materials Index. Why? Well, part of it may have to do with being a little over-inflated, but still, should we read anything into the monstrous pullback. Given how overbought we were, yes, we think we can make a couple of inferences. This current chart looks a whole lot like the one we saw in May of 2006 -- the one that ultimately drove the index down 42 points (-17.3%) before a bottom was made. Specifically, it's or was) 16.4% above its 200 day average. In May, it was 19.4% above the 200 day line when it ran into trouble. This sector is now under serious scrutiny.
Dow Jones Basic Materials Index - Daily

The close second award could have been shared by technology and cyclicals. Though not necessarily the days other biggest losers, the charts of those indices (any particular chart you choose would do) look especially troubling. Translation: the bend but don't break mode we've been in may have just moved to broken status. The utilities stock may have had it a little too good for tool long as well. Be leery.
Bottom Line
Don't misunderstand anything. Today is no reason to jump to conclusions abut any sector. It was a harsh selloff, but none of the sector ideas we discussed are set in stone. It may take a couple more days to see how things really shake out. However, we do think each idea is well worth monitoring closely.
Price Headley is the founder and chief analyst of BigTrends.com.
|