| Corcoran Technical Trading Patterns for February 28 |
| By Clive Corcoran |
Published
02/28/2007
|
Stocks
|
Unrated
|
|
|
|
Corcoran Technical Trading Patterns for February 28
The equity market succumbed to powerful waves of selling in yesterday's session. A combustible mixture of elements including the ongoing concerns from the sub-prime mortgage sector, increasing anxiety about Iran, the deterioration in some economic data plus a sense that the markets had become over extended in recent weeks was ignited by the spark of a sell-off in Shanghai. The correction in the Chinese market was severe but it needs to be seen in the context that the market there has been surging for weeks.
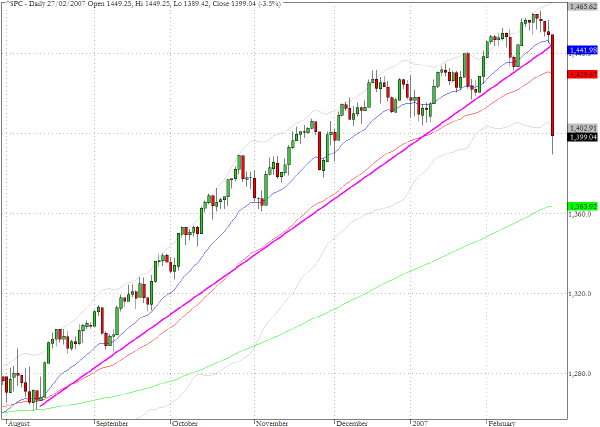
Our suspicion is that the appetite for risk had become mis-aligned with the upside potential for hedge funds and there was a rush for the exits by many hedge fund managers at the same time. The technical damage is apparent across the board. The S&P 500 broke decisively below its 50-day EMA for the first time since last August and then carried on quite a bit further down to close just below 1400. As we move on from yesterday's precipitating factor and get a calmer perspective on what is happening to the embryonic Chinese capital markets and an evaluation of whether we should expect a slowdown to the Chinese economy, we may find that the more serious problems lie closer to the domestic market and the wall of money that has been flowing into the hedge funds.
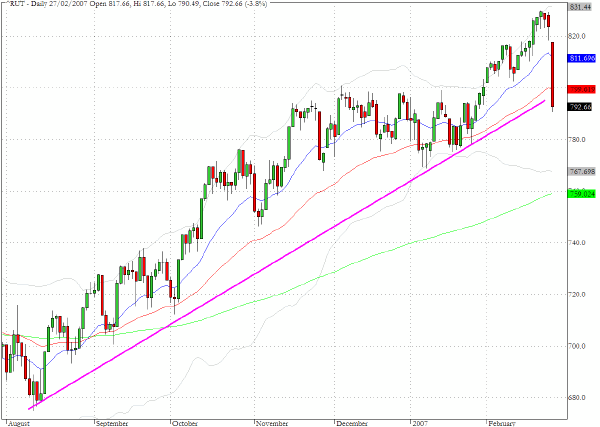
The chart for the Russell 2000 (^RUT) shows relatively less damage to the technical conditions than for the S&P 500 and the DJIA. The index retreated by 3.8%, which could have been worse given the unrestrained selling that took place yesterday, but the index has still not definitively violated the uptrend that has been in place since the recovery from the last sell-off in June/July 2006.
We'll be watching the Russell 2000 index today as a gauge of how profound the sentiment change might be following the market's drubbing yesterday.
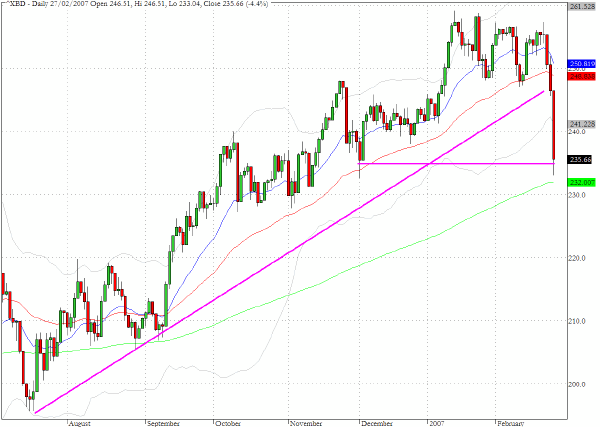
The broker/dealer index (^XBD) plummeted through several layers of potential chart support and violated the trendline through the lows since last summer. The index came to rest at 235 which coincides with the closing low from December 1st 2006.
On a general note our daily scan which covers the 600 most liquid US stocks revealed that more than 20% showed a negative change of more than five percent in yesterday’s trading and almost 40% showed a drop of more than five percent from their close five days ago.
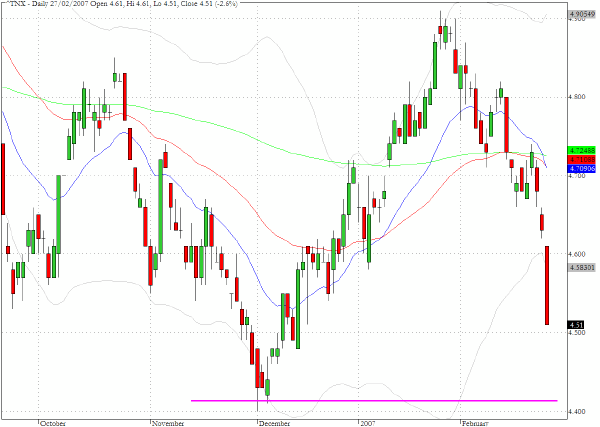
The yield on the ten year Treasury note (^TNX) dropped twelve basis points and closed at 4.51%. There is a combination of factors at work in this arena - evidence from the durable goods orders that the economy could be slowing more than expected which in turn is affecting the projected three month rates from forward futures contracts and a "flight to quality". The 4.4% level would seem to be an obvious target in coming sessions.
TRADE OPPORTUNITIES/SETUPS FOR WEDNESDAY FEBRUARY 28, 2007
The patterns identified below should be considered as indicative of eventual price direction in forthcoming trading sessions. None of these setups should be seen as specifically opportune for the current trading session.
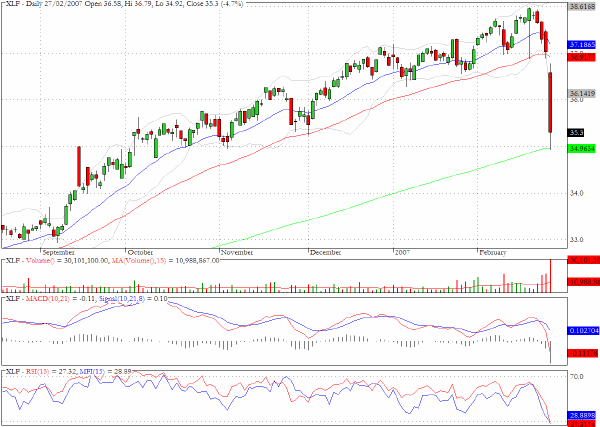
The exchange traded fund for the financial sector,XLF, provides a diversified exposure to a troubled sector. As we mentioned yesterday the real elephant in the room - and perhaps the more serious underlying problem for the markets to contend with is the fall out in the housing sector if the sub-prime lenders woes become more widely experienced by the general mortgage market. The big risk from a recession scenario is from an avalanche of mortgage delinquencies and foreclosures.
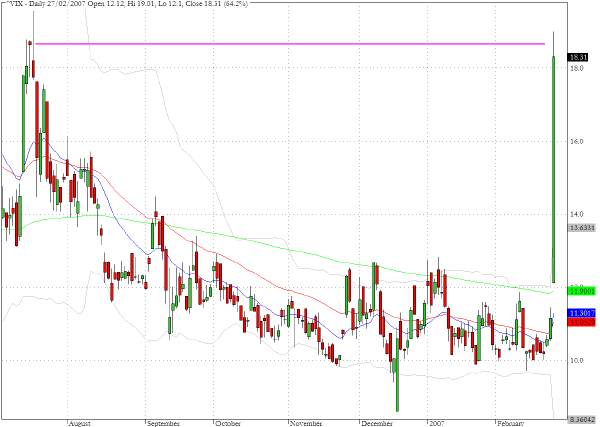
The CBOE Volatility Index (^VIX) sky rocketed in yesterday's trading - the percentage increase in implied volatility moved up by 64%. As the chart reveals the index came to rest at the same level as the mid-July spike up to 18. But this was the secondary spike to the last mini panic episode which began last May. The initial spike in the VIX on June 13 last year took the index to a closing high of 23.81.
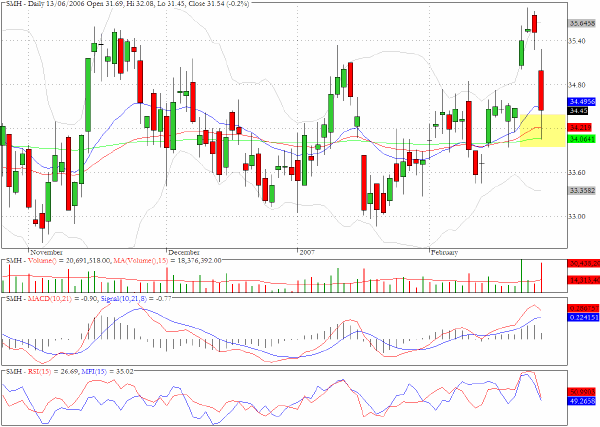
The ETF for the semiconductor sector, SMH, pulled back by 3% yesterday but the volume was notably less than last Thursday's upsurge. The sector also managed to close above its 50- and 200-day EMA's.
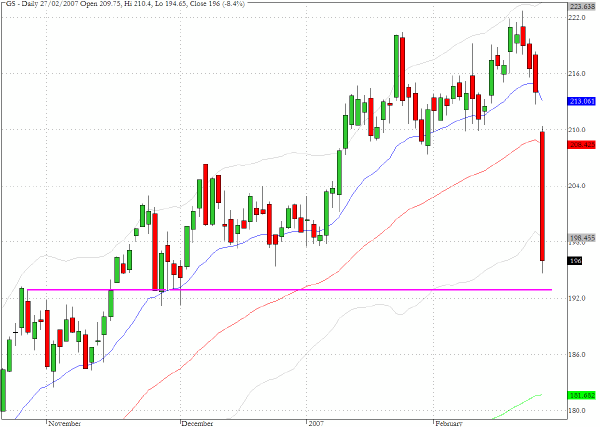
Goldman Sachs (GS) was one of the bigger casualties in yesterday's trading. It showed relative weakness even for the investment banks which were one of the most under pressure sectors. The stock lost more than eight percent and is now approaching a pivotal area on the chart.
Clive Corcoran is the publisher of TradeWithForm.com, which provides daily analysis and commentary on the US stock market. He specializes in market neutral investing and and is currently working on a book about the benefits of trading with long/short strategies, which is scheduled for publication later this year.
Disclaimer
The purpose of this article is to offer you the chance to review the trading methodology, risk reduction strategies and portfolio construction techniques described at tradewithform.com. There is no guarantee that the trading strategies advocated will be profitable. Moreover, there is a risk that following these strategies will lead to loss of capital. Past results are no guarante of future results. Trading stocks and CFD's can yield large rewards, but also has large potential risks. Trading with leverage can be especially risky. You should be fully aware of the risks of trading in the capital markets. You are strongly advised not to trade with capital.
|